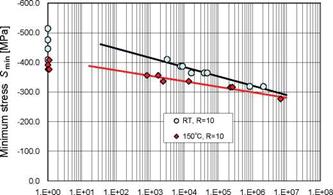
Fig. 5 presents the static OHC strength and S-N relationships obtained from compression fatigue tests for R=10 at RT and 150°C. From the two S-N lines in this figure and the Ъ or Ъ/a values in Table 4, compression fatigue strength Smin at RT and 150°C drops considerably with the increase in the number of load cycles N. Moreover, there is a clear difference between the two S-N lines at RT and 150°C. However, as N becomes larger, the difference between the lines tends to decrease.
The values of intersection a in Table 4 are very close to the highest values of static compressive strength plotted at N=1 for the RT and 150°C conditions, and higher than their mean in Table 2. Since the scatter of static compressive strength at RT is fairly large, the difference between the highest and mean values is fairly large. The static compressive strength is judged not suitable for regarding as a part of the S-N relationship. In contrast, at 150°C the static compressive strength has a small scatter and may be regarded as a part of the S-N relationship. However, generally including the data on static compressive strength in the compression fatigue data cannot be recommended.
As mentioned above, since the compression fatigue strength is greatly influenced by temperature and the number of load cycles, it becomes apparent that compression fatigue strength is a matrix-dominated property.
|
|
Number of cycles to failure N
Fig. 5. S-N diagram of OH specimens from compression fatigue tests, R=10, at RT and 150°C


