![For in-plane tests Подпись: [0]40 1600 1200 800 I 400 0](/img/1316/image563.gif) |
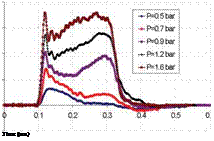
The strain rate evolution is sensitive to the entry pressure P in the chamber of compressed air (impact pressure of the striker on the input bar), the loading direction and the sample lay-up (angle в). The fibre orientation has an effect on the strain rate evolution. Figure 5 gives an example of the evolution of the strain rate vs. time of [0°]4d, [±20°]20, [±30°]20, [±45°]20, [±60°]20, [±70°]20 and [90°]4O. The presence of a second peak is the principal characteristic of these curves, which characterizes the onset of macroscopic damage, which we will see in detail in section 5. The critical pressure Pc responsible for the appearance of a second peak is shown in table 3. The appearance of a second peak is around 1.4bar for [0°]4O and between 0.6-0.9bar for the other orientations.

![For in-plane tests Подпись: 0.3 Time (ms) [±30] 20 Fig. 5. Strain rate versus impact pressure and stress-strain curve evolution, IP test](/img/1316/image565.gif)
![]() 1400
1400
1200
1000
800
Ш
600
c
400
200
0
-200
|
IP Tests |
o° |
±20° |
±30° |
±45° |
±60° |
±70° |
90° |
|
Pc (bar) |
1.2-1.4 |
0.9 |
0.8-0.9 |
0.8 |
0.7-0.8 |
0.7 |
0.6 |
|
Table 3. Critical impact pressure for appearance of second peak |
The dynamic behaviour for IP tests is dominated by compressive properties of the polymeric matrix and the damage kinetics is affected by fibre orientation. For non damaging tests, the fall of strain rate reaches negative values, which correspond to the springback in the sample. The combination of є = f (t) and a = f (t) curves, which will be discussed in the next paragraph, reveals that the second peak corresponds to the fall of stress in the
sample. The glass/epoxy composite materials present a high strength on compressive dynamic loading for out-of-plane tests (Bancroft, 1941).
 |
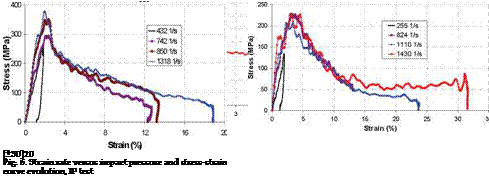
Figure 6 shows the dynamic behaviour of the laminates for the 9-impact pressure. One can note that couple [±20°]20-[±30°]2o and [±60°]20-[±70°]2o have similar tendencies. For the [90°]40 laminate, a brittle behaviour is noted, which is controlled by matrix failure. According to the various orientations, the nonlinear part of the a = f (c) curves is different and corresponds to different damaging modes.
[±70]20
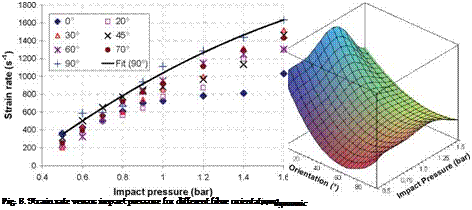
With a view to simplifying the graphic representations, the analyzed parameters Edynamic and amax will be given according to the impact pressure (P) and the fibre orientation в (Teta). Figure 7 shows the detailed trends of dependencies of Edynamic and amax on both fibre orientation and impact pressure. At a given impact pressure, the origin stiffness evolution with fibre orientation presents a minimum around 55°-65°. This tendency is not encountered in quasi-static loading for which a monotonic decrease associated with the fibre orientation increase of 0° to 90° can be analytically proved. This tendency can be explain by the fact that strain rate is not constant at a given impact pressure, as shown in Figure 8, and viscoelastic effects cannot be neglected. For the various orientations, the laminate stiffness Edynamic and the maximum stress amax increase with the impact pressure until a pressure threshold is reached from which the tendency is reversed; i. e. they decrease with the increase of impact pressure. Table 3 gives the pressure thresholds. The thermal softening due to inelastic heat dissipation and damage may explain this behaviour.
 |
(a) Maximum stress Fig – 7 °m„x and Edynamic versus P and 0


