Figure 7.2 and Figure 7.3 show summaries of the comfort criteria according to Fanger (1970). The complete calculations and evaluations as produced by Fanger are relatively complicated. Here it need only be said that if Fanger’s comfort criteria are wholly fulfilled, an estimated minimum of 5% of people will still be displeased with the climate (for some people, it will always be too warm or too cold). In other words, this is the lowest percentage of dissatisfaction that can be reached. One criterion for the climate conditions to be fulfilled is that the climate must be consistent throughout the whole room, with no variation in different areas or between the floor level
|
|||||||||||||||||||||||||||||||||||||||||||||||||||||||||||||||||||||||||||||||||||||||||||||||||||||||||||||||||||||||||||||||||||||||||||||||||||||||||||||||||
|
<0.1 |
24.4 |
1.00 |
|
|
None |
0.3 |
26.2 |
0.65 |
|
0.5 |
27.1 |
0.50 |
|
|
1.0 |
28.2 |
0.35 |
|
|
<0.1 |
19.9 |
0.95 |
|
|
0.5 clo |
0.3 |
21.6 |
0.60 |
|
0.5 |
22.4 |
0.50 |
|
|
1.0 |
23.3 |
0.35 |
|
|
<0.1 |
15.3 |
0.90 |
|
|
0.1 clo |
0.3 |
16.9 |
0.55 |
|
0.5 |
17.7 |
0.45 |
|
|
1.0 |
18.6 |
0.30 |
|
|
<0.1 |
10.9 |
0.85 |
|
|
1.5 clo |
0.3 |
12.5 |
0.50 |
|
0.5 |
13.2 |
0.40 |
|
|
1.0 |
14.0 |
0.30 |
|
|
High activity level |
0.3 |
22.1 |
0.60 |
|
None |
0.5 |
23.4 |
0.50 |
|
1.0 |
24.9 |
0.35 |
|
|
0.3 |
9.3 |
0.60 |
|
|
0.5 clo |
0.5 |
16.8 |
0.45 |
|
1.0 |
18.2 |
0.35 |
|
|
0.3 |
9.3 |
0.60 |
|
|||||||||||||||||||||||||||||||||||||||||||||||||||||||||||||||||||||||||||||||||||||||||||||
|
||||||||||||||||||||||||||||||||||||||||||||||
|
|
 |
|
|
|
|
![]()
kJ/Time

 |
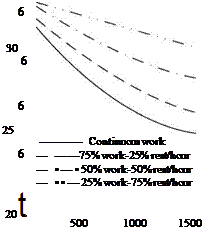
Recommended limit values for heat exposure with workload.
FIGURE 7.2 Proportion of people in any one environment who will be dissatisfied with their thermal comfort.
and the ceiling level, for example. Neither should there be any cold surfaces in the room which could cause cooling or ‘cold radiation’—that is, cold surfaces towards which the body emits radiant heat but receives little in return—resulting in a local cooling of the body. This can include window areas.
It is most common to find sedentary work in the control room and for operators to be lightly clothed. In this case the relative humidity should be around 50%, the maximum air speed should be 0.1 ms-1, and the air temperature should be 26°C. If it is
Relative humidity = 50%
 |
|
Radiant temperature = air temperature
Temperature (°C)
Normal clothing Light clothing
FIGURE 7.3 Effect of air speed on optimum comfort temperature.
felt from an economic point of view that this is too high a temperature, the operators would have to be asked to wear somewhat warmer clothing such as long trousers and a jacket or pullover. With this type of clothing being worn, the conditions should be 50% relative humidity and 0.1 ms-1 air movement with an air temperature of 23°C.
In control rooms where there is a certain amount of physical activity, such as walking between the various control panels and working mainly in a standing position, the temperature (with normal clothing) can be dropped to 19 to 20°C and air speeds up to 0.2 ms-1 can be accepted. The air speeds in the room will increase in any case due to the movement of people in the room.
In many control rooms the work is more sedentary at night than in the daytime and it may therefore be best to have slightly higher temperatures at night, 21 to 22°C compared to 19 to 20°C during the day.
As different people have varying requirements regarding what is an acceptable climate, the operators should be able to regulate the climate. The air humidity should be kept between 40 and 60%. If the humidity is low, the air feels cooler, so higher air temperatures are needed. Low humidities can cause a drying-out of the mucous membranes of the nose and throat, which in turn can lead to an increased risk of throat and chest infections.


