The result of Pearson correlation analysis is summarized in Table 14.6. The results depicted a negative correlation between several types of LULC and the rate of land degradation: forest (—0.86), mixed plantation (—0.74), and shrub/bush (—0.49),
 |
|
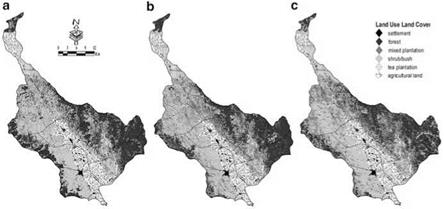
Fig. 14.2 Land use/land cover maps of the Batang Merao watershed in 1990 (a), 2000 (b), and 2010 (c) |
|
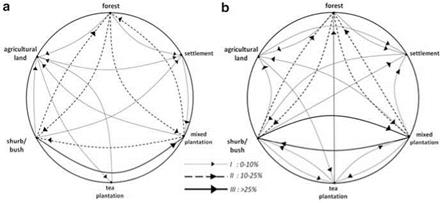
Fig. 14.3 Dynamic patterns of land use/land cover change in Batang Merao watershed in the periods 1990-2000 (a) and 2000-2010 (b) |
respectively. The negative correlation implied that the larger are forest area, mixed plantation, and shrub/bush, the lower is the land degradation. However, there were some positive correlations between low-vegetation land use type and nonvegetation type to the rate of land degradation: agricultural land (0.95), settlement (0.75), and tea plantation (0.15), respectively, the larger. The positive correlation implied that the larger are agricultural land, tea plantation, and settlement, the higher is the level of land degradation in the watershed.
|
|||||||||||||||||||||||||||||||||||||||||||||||||||||||||||||||||||||||||||||||||||||||||||||||||||||||||||||
|
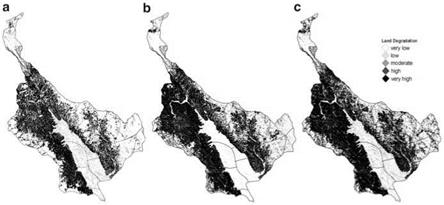
Fig. 14.4 Land degradation maps of the Batang Merao watershed in 1990 (a), 2000 (b), and 2010 (c) |
|
Table 14.6 Pearson’s correlation between LULC type and land degradation
|
14.3 Discussion and Conclusion
In general, the results of the study disclosed that the Batang Merao Watershed had been under continual LULC changes from 1990 to 2010. Deforestation caused by agricultural activities (expansion of plantations and paddy fields) and increasing demand for settlement have imposed a threat of land degradation. This information is essential to preserve the natural protected areas. The results also showed that the areas were dominated by high levels of land degradation. The mean annual potential land degradation amounted to 128.03 tons ha-1 year-1 in 1990, 144.68 tons ha-1 year-1 in 2000, and 194.14 tons ha-1 year-1 in 2010.
According to the statistical analysis, this research showed that there was a relationship between the type of LULC and land degradation. Vegetation has an
important role in protecting soil from erosion loss and is the key factor affecting land degradation in the watershed (Zhou et al. 2008). In addition, vegetation cover affected land degradation because of its litter production, organic matter accumulation, and plant roots (Wijitkosum 2012).
The results also concluded that changes in LULC and its dynamics were closely associated with human activities in the region such as the expansion of paddy fields and settlements. The results of the study clearly indicated that dynamic changes in LULC had been a driver of extensive land degradation in the study area. It showed areas with a high potential of land degradation as indicated by the mean annual land degradation in the study period. Among the USLE factors, the value of the LULC factor was dynamic over time and increased the total value and level of potential land degradation. The wide range of land degradation was subject to agricultural activities (agricultural land and mixed plantations).
Assessment of LULC dynamics and its linkages is an essential part in sustainable land management that can help people optimize land use and minimize environmental impacts such as land degradation. Therefore, to prevent an extremely high level of land degradation in these areas, the wise use of a land cover and soil conservation program is highly recommended to be widely implemented in the tea plantation and agricultural land.
Acknowledgments The authors acknowledge the Center for Development, Education and Training of Indonesian Planner (Pusbindiklatren-Bappenas RI), Regional Development Planning Board of Jambi Province, and the Global Environmental Leaders (GELs) Program of Graduate School for IDEC, Hiroshima University. We thank to Mr. Aris Rusyiana (a staff member of Indonesian Statistics Agency) for his statistical assistance.


