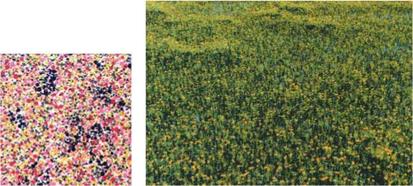
A somewhat more intricate model describes the development of a plant association with different species. In [39] open L-systems are used for this process, though simulation can also be programmed in a more simple way using other methods.
Each species is described by a number of values. The values include the rate of new plants per simulation step, the maximal size of the plant plus the associated circle diameter, the average growth rate, the probability of the plant to die when the competition with another plant is lost, as well as the preference for dry or wet locations.
A single plant is characterized by its type, its individual size, and its growth rate. The growth rate is obtained from the interval [0..1], and is determined by multiplication of a random value with the local water content of the soil and the plant’s preference for wet locations. The ability to assert itself in the competition for growth is the result of the growth rate and the relative size.
 |
 |
In the case of the intersection of two plants and their corresponding circles, their competitive abilities are compared. The weaker plant is dominated by its competitor and dies. This takes into consideration that some plants may also survive regardless of their competitors demanding a greater part of the resources.
By adding new plants per simulation step, the initial plant cover evolves after some time into a continuous developing plant association that adjusts to the dynamic environmental changes.
Figure 8.7 shows a snapshot of this type of simulation. Eight species are competing for propagation in a terrain described by Fig. 7.7. Plants with a preference for wet soil, here drawn in dark blue, prefer to spread in wetland. The final result shows some 10,000 plants. In this image a total of approximately 2 billion polygons exist, since no data-reduction techniques were applied.


