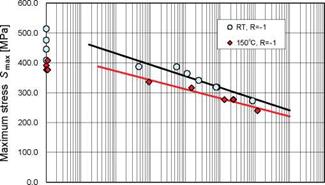
Fig. 6 shows the static OHC strength and S-N relationship obtained from tension – compression fatigue tests for R=-1 at RT and 150°C. Since compression load repetition greatly influences fatigue life in tension-compression fatigue tests, as described later, static OHC strength was plotted at N=1 as in the case of compression fatigue. According to the S – N lines at RT and 150°C and the Ъ values in Table 4, Smax apparently decreases with increasing N. Moreover, there is an apparent difference between the two S-N relationships at RT and 150°C, as was the case in the compression fatigue tests. The tension-compression fatigue strength is strongly dependent on temperature and the number of load cycles, as in the compression fatigue tests.
Furthermore, these S-N lines pass fairly above their mean compressive strengths given by compressive Su in Table 2. Generally, Su is considered to be not included in the S-N lines in Fig. 6 at both RT and 150°C.
As mentioned above, since the tension-compression fatigue strength is strongly influenced by temperature and the number of load cycles, it is also judged to be a matrix-dominant property.
|
1.E+00 1.E+01 1.E+02 1.E+03 1.E+04 1.E+05 1.E+06 1.E+07 1.E+08 Number of cycles to failure N Fig. 6. S-N diagram of OH specimens from tension-compression fatigue tests, R=-1, at RT and 150°C |


