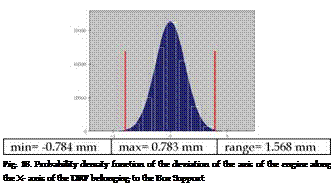
Monte Carlo simulation has allowed to perturb dimensions and geometry of the winch arm components inside the tolerance ranges in order to give the statistical distribution of the deviations of the axis of the engine and of the orientation of the After Cowling. Monte Carlo simulation has been carried out by a well-known Computer Aided Tolerance software, eM – Tolmate of UGS®. The number of runs of simulation has been fixed at 200000, once many tests have been carried out, since this value guarantees a stable estimation of the mean and the standard deviation of the probability distribution characterising the two measurements. The deviation of the axis of the engine follows an estimated probability density function near to Gaussian along the considered X and Y-axes, as shown in Fig. 18 and Fig. 19. The estimated mean is equal to -0.0005 mm along the X-axis and 0.000 mm along the Y-axis, while the estimated standard deviation is equal to 0.251 mm along the X-axis and 0.294 mm along the Y-axis. Therefore, the axis of the engine may range between -0.88 mm and +0.88 mm (i. e. ±3ct) that include 99.73% of the obtained Gaussian distribution. This range does not significantly influence the right working of the engine.
 |
The deviation of the orientation of the After Cowling has been evaluated as the three translational motions (AX, AY and AZ) of the centre of the ellipse along the three axis of the DRF of the After Cowling and the three rotations (Aa, Ap and Ay) of the axis of the Cowling around the three axes of the DRF of the After Cowling. The three translations and the three rotations follow an estimated probability density function that may be considered Gaussian, as shown in Fig. 20 and in Fig. 21. Table 1 shows the mean and standard deviation that have been estimated for the obtained probability density functions.
|
Fig. 19. Probability density function of the deviation of the axis of the engine along the Y – axis of the DRF belonging to the Box Support |
|
Fig. 20. Probability density function of the three translations motions of the centre of the ellipse of the After Cowling along the three axes of its DRF: X-axis on the left, Y-axis in the middle and z-axis on the right |
|
Fig. 21. Probability density function of the three rotations of the axis of the After Cowling around the three axes of its DRF: X-axis on the left, Y-axis in the middle and Z-axis on the right |
The obtained results underline that the After Cowling may significantly translate along the largest axis of the ellipse (Y-axis) of about ± 0.531 mm and along the axis perpendicular to the plane of coupling of the After Cowling with the After Frame (Z-axis) of about ± 0.709 mm, while the translation along the X-axis is negligible. Moreover, the After Cowling may significantly rotate around the Z of about ± 0.724 radiants, while the rotations around X and Y axes are negligible. This is due to the coupling of the After Cowling with the After Frame by means of the screws that get into the holes of the parts with a certain clearance.
|
Measurements of the After Cowling |
nominal value |
mean |
standard deviation (o) |
3o |
|
ДХ [mm] |
0.0000 |
0.0001 |
0.0256 |
0.0768 |
|
ДУ [mm] |
0.0000 |
-0.0007 |
0.1771 |
0.5313 |
|
Д2 [mm] |
0.0000 |
-0.0005 |
0.2364 |
0.7092 |
|
Да [rad] |
0.0000 |
0.0000 |
0.0010 |
0.0030 |
|
ДР [rad] |
0.0000 |
0.0000 |
0.0010 |
0.0030 |
|
ДY [rad] |
0.0000 |
-0.0005 |
0.2414 |
0.7242 |
|
Table 1. Estimated parameters of the probability density function of the After Cowling |
7. Conclusion
The present work deals with the tolerance analysis of freeform surfaces belonging to parts in composite material and that may be non-rigid. This chapter presents a method to carry out the tolerance analysis of an assembly involving free-form surfaces in composite material by using a commercial CAT software. The great effort of the present work is overcome the limits of the CAT software to deal with dimensional and geometric tolerances applied to free form surfaces in composite material. The proposed method is constituted by seven steps. The first one verifies the stiffness of the assembly components by means of Finite Element Method® in order to evaluate the possibility to apply the tolerance analysis models developed for rigid assemblies. The second step designs the measurements of the assembly; the third defines the features of the assembly components; the fourth specifies the tolerances and the related statistical distribution; the fifth designs the assembly cycle and jigs; the sixth chooses the simulation runs and carry out simulations and the seventh analyses the results. The method has been applied to the winch arm mounted on an helicopter. All the components of the winch arm assembly are made in carbon fiber composite material. Assembly operations among the parts are done through special screws that are inserted in the holes of each component. No adhesives or resins are used to secure the surfaces, since a perfect adhesion is not required. The method has allowed to verify some functional requirements of the winch arm. In particular, it has verified that the applied tolerances do not compromise significantly the assembly of the engine to rescue people or things. Moreover, it has underlined the possible changes in the Cowlings’ orientation and location that may modify the aerodynamic performances of the winch arm.


