A total of 58 SST tests in four sets (i. e. I-12 tests, II-16 tests, III-12 tests, IV-18 tests) were performed on CFRP plates (38) and sheets (20) applied on two opposite longitudinal faces of 29 concrete prisms. Concrete mix was specifically designed to obtain low compressive concrete strength to simulate the FRP application on existing concrete. Compressive tests were performed at 28 days after casting: the cylinder mean strength, fcm, was equal to 23.82 MPa, 21.46 MPa, 26.00 MPa and 19.00 MPa for set I, II, III and IV respectively. CFRP Young’s moduli, Ef, were obtained by means of tensile flat coupon tests: their mean values were between 110-220 GPa for plates and 170-240 GPa for sheets. Prior to FRP installation, the concrete surface was treated by sand paper (sets I, II, III) or by bush hammering (set IV), in order to eliminate the mortar till the aggregate became clear. Primer was always used to consolidate the concrete surface except for specimens of set VI. Further details related to experimental tests of each set can be founded in (Nigro et al. 2008, Savoia et al. 2009, Bilotta et al. 2009, Bilotta et al. 2011).
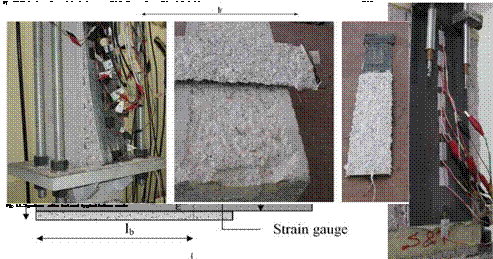
Note that several strain gauges were applied along the FRP laminates in order to measure axial strains during the bond test (see Fig. 10b, c). Experimental readings allow theoretical models of the adhesion laws to be to verified or calibrated.
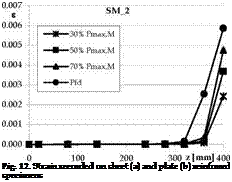
The behaviour of the FRP-to-concrete interface was analyzed by plotting the experimental axial strains £i(z) measured by means of strain gauges during the test along the FRP reinforcement. Strains recorded along FRP plates at different load level are plotted in Fig. 12a, b for sheets and plates respectively. The first debonding load, Pfd, identified the beginning of debonding.
Note that the maximum strain recorded at the loaded ends of FRP sheets was Ssheets ~ 0.6%; for plates it was significantly lower (spates ~ 0.2%), even if, for both types of reinforcement, the bond length was higher than the theoretical effective one, Leff =^(Ef ■ tf) / (2 ■ fctm), evaluated according to fib bulletin 14 (2001) and CNR-DT200/2004 (2004), where fctm is the mean tensile strength. Such result is mainly due to the higher stiffness of plates; indeed, as showed above by (63), the FRP stiffness, Eftf, is the main parameter affecting the debonding strain, being maximum strain at debonding phenomenon being the maximum strain due to debonding proportional to the factor ^/1/(Eftf). In particular, the ratio
( 1/(Eftf)) / ( 1/(Eftf)) of FRP reinforcements investigated in Fig. 12 is 2.5
sheets plates
similar to Ssheets / ^plates ^ 3. Moreover, since plates are about eight times thicker than sheets while the ratio between Young moduli is very close to unity (i. e. Ef, s/Ef, p=1.35), this result seems to confirm that the reinforcement thickness particularly affects debonding behaviour. Indeed, the greater the thickness, the higher the increase in the normal and shear stresses at FRP to concrete interface and consequently the probability of premature debonding occurrence (Oehlers and Moran, 1990; Tounsi et al., 2009).
|
PM |
_2 |
|
|
30% Pmax, M |
||
|
50% Pmax, M 70% Pmax, M |
||
|
■ ■ ■ |
|
0.007 є 0.006 0.005 0.004 0.003 0.002 0.001 0.000 |
|
0 100 200 300 z [mm] 400 |
 |
(a) (b)
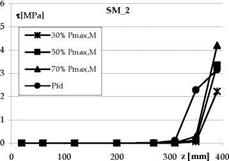
The interface shear stresses Ti(z) were obtained by the variation of axial stress and, hence, strain throughout the FRP by the following relationship between two strain gauges at distance Azi, i+1
where Ef and tf are FRP Young’s modulus and thickness, respectively. Typical shear stress profiles assessed for sheets and plates, respectively, are reported in Fig. 13a, b.
 |
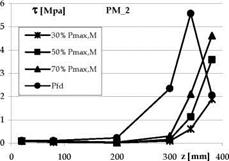 |
Note that, at the loaded end of the reinforcement, the shear stresses assessed for loads close to the debonding of the reinforcement are lower than those assessed for lower loads. This indicates that in this zone of the reinforcement the shear-stress-slip law is in the softening stage typical of a post-elastic behaviour.
(a) (b)
Fig. 13. Shear stresses assessed on sheet (a) and plate (b) reinforced specimens
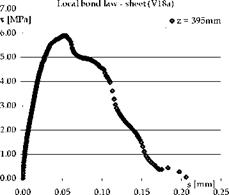
The shear-stress-slip relationship, describing the FRP-to-concrete interface law, can be identified starting from the experimental results of pull-out tests; the distribution of shear stresses could be, in fact, obtained by Eq. (65) and the corresponding slips values by integrating the axial strains measured during the test by the following relationship
(sk +1 +Sk) ( ) !ґґ
si, i+1 =LT———- о—— " 4xk+1 – xk) (66)
k=0 2
 |
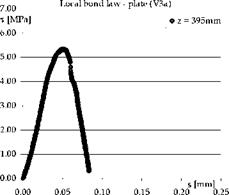 |
In particular the bond law at the FRP-to-concrete interface (see Fig. 14) can be obtained by calculating the shear stresses using Eq. (65) (considering the strains recorded by two gauges nearest the loaded end of FRP, see Fig. 10) and the corresponding slips using Eq. (66) (considering all the strain gauges applied on the FRP reinforcement).
(a) (b)
Fig. 14. Experimental bond law at the FRP-to-concrete interface: sheet (a) and plate (b)
In this way a direct identification method (DirIM) is put in place since the interface law is obtained directly with respect to experimental values of shear stresses and relative slips.
As stated above, according to the study made by Taljsten (1996), derived by linear fracture mechanics, the maximum value Fmax of the force applied to the FRP-to-concrete joint can be obtained by (63) where GF is the specific fracture energy of the interface depending on the mechanical properties of the adhesive FRP-to-concrete interface.
Although plenty of alternative models are available in the literature (i. e. Savoia et al., 2003) to describe FRP-to-concrete interface interaction, a simplified bi-linear relationship can reproduce the key aspects of the interface behaviour as pointed out by the comparative study carried out by Lu et al. (2005). Elasto-softening bilinear relationship is one of the most widely accepted expressions for the interface relationship and fracture energy; three mechanical parameters completely identifies such relationship (maximum shear stress Tmax, ultimate slip su, and elastic stiffness ke), but obviously the knowledge of GF by solving equations (63) and (64), is not sufficient for determining such parameters.
As widely discussed in Faella et al. (2009), two approaches are mainly possible to calibrate an interface relationship: the first approach (Direct Identification Method – DirIM) starts
from the experimental strains measured during the test: the distribution of shear stresses can be roughly evaluated through equilibrium of the axial stresses depending on the axial strain by (65); the corresponding slip values can be obtained by integrating throughout the FRP the
axial strains by (66). The couples of values (sj, xj) can be "directly" used to calibrate the т-s
relationship through a numerical regression, such as the least square method. Although the DirIM is very easy under the analytical standpoint, the drawback of the method is that the distribution of shear stresses cannot be directly compared with data provided by the pull out tests, because both interface shear stresses and local displacements cannot be directly measured during the usual pull-out tests. In order to overcome such problem, the indirect identification procedure (IndIM) can be pursued to calibrate an interface relationship starting from the availability of axial strain evolution in FRP plate at different load levels up to debonding failure: once a bi-linear interface relationship has been assigned, the corresponding theoretical strain distributions can be evaluated and compared with experimental data; the procedure is iterative and ends when the difference between theoretical and experimental strains is less than a prefixed tolerance (Faella et al., 2003).
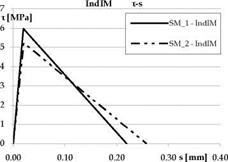
With reference to some experimental data (Nigro et al., 2008) both DirIM and IndIM have been applied in order to plot the т-s relationship and derive the corresponding specific fracture energy GF, computed by totalling up the area under the bi-linear curve.
Table 1 shows that IndIM leads to specific fracture energy GF larger than those computed by DirIM in almost all analyzed cases. Moreover, in the case of experimental tests carried out by the authors, values of GF obtained with IndIM are as stable as the measured failure loads Ptest, confirming the superior accuracy of IndIM with respect to DirIM. Some of the most representative bi-linear interface relationships obtained by applying both DirIM and IndIM are reported in Fig. 15.
|
Label |
PM_1 |
PM_2 |
PM_3 |
SM_1 |
SM_2 |
SM_3 |
|
|
Gf |
(DirIM) |
0.45 |
1.20 |
0.86 |
0.66 |
0.86 |
0.48 |
|
Gf |
(IndIM) |
0.73 |
1.75 |
1.03 |
0.66 |
0.67 |
0.72 |
|
GF,(IndIM)/GF,(DirIM) |
1.61 |
1.46 |
1.20 |
0.99 |
0.78 |
1.50 |
|
Table 1. Specific fracture energy GF: (DirIM) Vs (IndIM) |
 7 DirIM т-s
![Experimental results Подпись: 0.00 0.10 0.20 0.30 s [mm] 0.40](/img/1316/image865.gif) T
T
6
5 4 3 2 1 0
Two methods lead to results that could be even significantly different, especially in terms of ultimate slips. Furthermore, the ascending branches of DirIM curves are characterized by a lower slope with respect to IndIM.
 |
|
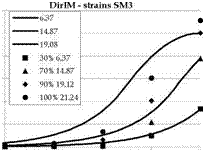
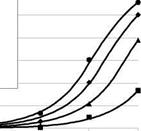
Comparisons between the theoretical and experimental values of the axial strains throughout the FRP plate are reported, for different values of load test, in Fig. 16. The results are referred to test SM_3. The theoretical strain values have been obtained by closed-form solutions reported in Faella et al. (2003).


![]()
![]()
![]() 0.006
0.006
Є
0.005
0.004
0.003
0.002 —
0.001
0.000
320
Fig. 16. Theoretical and experimental strains: (DirIM) Vs (IndIM)
The theoretical values of strains obtained assuming the interface relationship identified through IndIM are much closer to the observed ones than the values which can be derived assuming the т-s relationship calibrated by means of DirIM. Finally it is worth observing that the experimental data can be simulated with good accuracy even if a simplified adhesion law (i. e. a bilinear adhesion law) is assumed.

