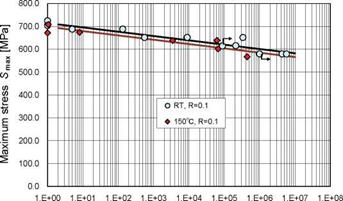
Let us examine S-N (stress-life) relationships on semi-logarithmic graph paper based on net section stress, placing the maximum stress Smax on the ordinate and the logarithm of fatigue life logN on the abscissa, where N is the number of load cycles to failure. In compression fatigue, the minimum stress Smin is used instead of Smax on the ordinate. If N is assumed to be an independent variable on the S-N diagram, Smax will be a dependent variable and can be regarded as fatigue strength. OH static strength is plotted as Smax at N=1 to compare it with fatigue strength. An S-N relationship is assumed to be linear on semi-logarithmic graph paper. The S-N line approximating only S-N data is determined by the least-squares method.
The S-N equation is represented by
Smax = a – b • log N (2)
where a and b are constants and treated as parameters, i. e., intersection and slope. Since the slope of the S-N relationship in this study is quite small, N is dealt with as an independent variable and Smax as a dependent variable to aid intuitive understanding. Table 4 shows the
parameters of S-N equations for three kinds of R. In order to discuss tension-compression fatigue-test results later, the Srange-N relationship for compression fatigue is also shown in Table 4, where Srange (=Smin-Smax) is the compression repeated stress range.
|
Fatigue test & S-N relationship |
Temp. |
Parameters |
|
|
a (MPa) |
Ъ (MPa) |
||
|
Tension, Smax-N, (R=0.1) |
RT |
714 |
18.9 |
|
150°C |
698 |
18.9 |
|
|
Compression, Smin-N, (R=10) |
RT |
-510 |
-31.4 |
|
150°C |
-410 |
-18.6 |
|
|
Tension-compression, Smax-N, (R=-1) |
RT |
508 |
38.2 |
|
150°C |
433 |
30.4 |
|
|
Compression, Srange-N, (R=10) |
RT |
459 |
28.3 |
|
150°C |
369 |
16.7 |
|
Table 4. Parameters of S-N equations 3.2.1 Tension fatigue strength Fig. 4 shows the static OHT strength and S-N relationships from tension fatigue tests for R=0.1 at RT and 150°C. In the RT fatigue tests, an arrow shows those run-out specimens whose fatigue tests were terminated without specimen failure; however, these points were included in the S-N data when approximated by an S-N line. Therefore, the S-N line at RT provides a conservative estimate. From the two S-N lines in this figure and the Ъ values in Table 4, the S-N relationships at RT and 150°C have equal slopes and are considered to be parallel. Moreover, the difference between fatigue strength at RT and 150°C is close to the difference of the mean static strength at N=1 regardless of N. That is, the test results showed that the difference in static strength in the two environments appeared in the difference in fatigue strength. This fact points out that a difference between the S-N lines at RT and 150°C exists but it is very small. Furthermore, since the slope of the S-N line is small, the decrease in Smax is small with an increase in N at either RT or 150°C. |
|
Number of cycles to failure N |
The mean tensile static strength is 714 MPa at RT and 690 MPa at 150°C in Table 2. Meanwhile, the intersection a in Table 4 is 714 MPa at RT and 698 MPa at 150°C. Although there is a slight difference between the static strength and the intersection of the S-N line at 150°C, static strength can be treated as a part of the S-N relationship for R=0.1 in both environments.
The fact that tension fatigue strength is slightly influenced by temperature and load repetition means that it is strongly fiber-dominated. However, since these small effects are real, the fiber dominance is not total.


