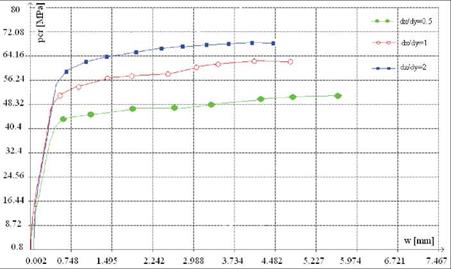
The plate is considered as clamped on the sides. The in-plane loading was applied as an uniform compressive pressure in the x direction (Fig. AA12). The force was increased step by step (with and certain increment). In the figure AA13, the variation of the transversal displacements of the central point, versus applied loading is drawn. Each curve corresponds to one diameters ratio.
Buckling load has been determined by the graphical method. On each curve that corresponds to a delamination type, an asymptote on curve after the bifurcation has been plotted. Critical value for the buckling load was obtained in the range:
43.41 MPa < pcr <59.5 MPa
In the case of nonlinear model of the material behaviour the buckling load (ultimate strength) was determined by Tsai Wu criterion. So, the degradation index (failure index) for tension and compression of the delaminated plates was determined (Table AA7). Only the plate global buckling was examined.
|
Failure mode |
Fail 1 (Tension) |
Fail 2 (Compression) |
|
Dx/Dy=0.5 |
35 |
74 |
|
Dx/Dy=1 |
37 |
78 |
|
Dx/Dy=2 |
39 |
82 |
|
Table 17.5. Buckling load (ultimate strength) in [MPa] for compression loading |
|
Fig. 17.13. Compression buckling and post buckling behaviour of the plates with central delamination placed between macro-layers 4 and 5 |


