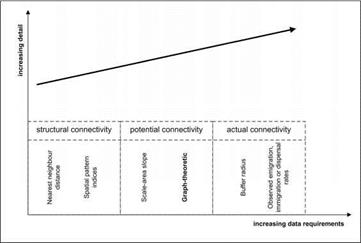
Land use change and the physical and functional disconnection of ecological networks represent one of the driving forces of biodiversity loss (Zetterberg et al., 2010; Bundesamt fur Naturschutz, 2004; Spangenberg, 2007; Reck et al., 2010). Beside a lot of different methodologies (see Fig. 8) network analysis and graph theory provide powerful tools and methods for analyzing ecological networks (Pietsch & Kramer, 2009; Urban et al., 2009; Zetterberg et al., 2010). There are three different types of connectivity analysis that can be classified according to the increasing data requirements and detail (Calabrese & Fagan, 2004).
|
Fig. 8. Different types of quantitative connectivity analysis (adapted from Calabrese & Fagan, 2004; Wolfrum, 2006) |
Graph-theory can be used as a method with very little data requirements, easy to use and not as sensitive as other methods against changes in scale (Urban et al., 2009; Bunn et al., 2000; Calabrese & Fagan, 2004; Urban & Keitt, 2001; Saura & Pascual-Hortal, 2007; Pascual – Hortal & Saura, 2006). Several graph-theoretic metrics related to classical network analysis problems had been developed and tested and ecologically interpreted (Bunn et al., 2000; Urban & Keitt, 2001; Wolfrum, 2006).
 |
In graph-theory a graph is represented by nodes (e. g. habitats) and links (dispersal). A link connects node 1 and node 2 (see Fig. 9) (Tittmann, 2003; Urban & Keitt, 2001; Saura & Pascual-Hortal, 2007; Wolfrum, 2006). If the distance between two nodes is longer than the specific dispersal rate the link is missing, if the distance is in the dispersal range there is an existing link (Pietsch & Kramer, 2009; Zetterberg et al., 2010).
 |
 |
The graph-theory models can be distinguished in binary and probability models (Pascual – Hortal & Saura, 2006; Saura & Pascual -Hortal, 2007; Bunn et al., 2000; Urban & Keitt, 2001). Using binary models it’s only possible to analyze if there is a link or not, while using probability models it’s possible to analyze the existing situation (if there are links or not) and to evaluate each specific patch (habitat) (see Fig. 10) (Bunn et al., 2000; Urban & Keitt, 2001; Zetterberg et al., 2010). The distance between the nodes can be represented as edge-to-edge interpatch distance, as Euclidian distance or as least-cost path (Tischendorf & Fahrig, 2000; Ray et al., 2002; Adriaensen et al., 2003; Nikolakaki, 2004; Theobald, 2006, Zetterberg et al., 2010).
Fig. 10. Evaluation of specific habitats of Zootoca vivipara (example) (the bigger the more valuable) (left); patches and connectivity zones (right)
Using these techniques critical parts of a network can be identified e. g. through patch removal (Keitt et al., 1997; Zetterberg et al., 2010; Pietsch & Kramer, 2009), the different patches can be ranked according to their importance (Urban & Keitt, 2001) and natural and man-made barriers and breaks can be found (Zetterberg et al., 2010). They can be used as evaluation tools in the planning process or to analyze and visualize different possible scenarios for the participation process or to define areas that are most important for specific measures. In combination with cost-distance modeling (Adriaensen et al., 2003; Theobald, 2006; Zetterberg et al., 2010) and improved knowledge about species preferences and dispersal (Pietsch & Kramer, 2009) the tools are helpful to reduce negative ecological impact and find appropriate solutions in the landscape planning process.


