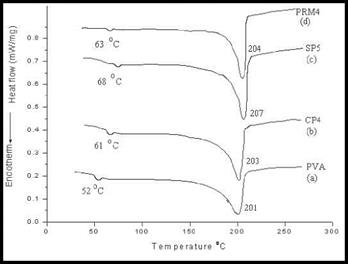
DSC traces of PVA and polymer nanocomposite materials are shown in Fig. 22. PVA exhibited an endotherm at 52.oC corresponding to the glass transition temperature (Tg) of PVA [90]. All the nanocomposite materials with different critical loading percentage of modified red mud were found to have a high Tg compared to the bulk PVA. This could tentatively be attributed to the confinement of the intercalated polymer chains within the red mud galleries that prevents the segmental motions of the polymer chains, thereby enhancing the glass transition temperature of the polymer matrix. The nanocomposite membrane SP5 showed maximum Tg and melting temperature (Tm) of 68 oC and 207 oC respectively. Thereby, revealing efficient dispersion of BRM within the polymer matrix.. The glass transition temperature (Tg) and melting temperature (Tm) of pure PVA and PVA nanocomposite membranes have been tabulated in table 11.
|
Fig. 22. DSC thermograms of (a) PVA (b) CP4 (c) SP5 (d) PRM4 |
|
Sample |
U О н“ |
U О нє |
|
Pure PVA |
52 |
201 |
|
CP4 |
61 |
203 |
|
SP5 |
68 |
207 |
|
PRM4 |
63 |
204 |


