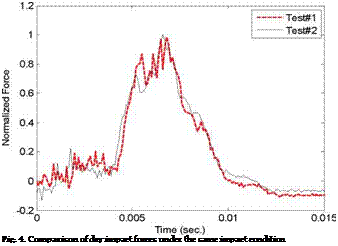
The impact test is conducted for the dry and wet composite plates. The mass of the free falling object is 12 Kg which is dropped from the height 1.06 m. In order to confirm the repeatability of the impact test data, every test condition is repeated several times for the same composite plate. The measured force and strain data are very close to one another. This fact confirms not only repeatability but also confirms there is no damage in the specimen. If damage occurred and accumulated in the composite plate, repeated testing would show different results with the damage. Figure 4 compares the two force data under the same dry impact condition. Other force data, which are not plotted here to avoid crowding, are very close to the graphs shown in the figure. In all figures unless otherwise mentioned, the force or strain plots are normalized in terms of the dry impact data so that the effects of FSI can be better represented in the plots.
 |
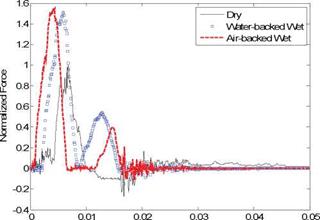
The impact force is compared in Fig. 5 for the dry impact as well as the water-backed and air-backed wet impact cases. As shown in this figure, the air-backed and water-backed wet impacts yield 55% and 50% greater impact force than the dry case, respectively. The larger
|
Time(sec.) Fig. 5. Comparison of impact forces among dry, water-backed and air-backed wet impact cases |
wet impact forces are caused by the hydrodynamic added mass effect. Because the mass of the composite plate is only 1.6 times greater than that of water, the plate with the added mass moves with a much slower velocity. As the plate moves more slowly, the contact force between the impactor and the plate becomes larger, which is recorded to the force gage. In order to support this argument, a series of finite element analyses is conducted in the next section.
Both wet impact forces have steep monotonic increases to their peak values just after the impactor hit the plates while the dry impact force shows an initial low plateau before it moves steeply to its peak value. Because the impactor is not held after the initial impact, it rebounds and lands again. As a result, both wet impacts show secondary peak forces. However, the dry impact does not have the secondary contact. In particular, the air-backed wet impact case gives a quite a delay between the initial and secondary impact forces while the water-backed wet impact case shows the secondary force occurring just after the initial one.
The reason that the air impact test does not produce the secondary impact is due to the spring in the impact test machine. The spring supports the impact rod which is supposed to hit the composite plate from a small distance above the plate before the impact loading. As the impact weight drops and hits the impact rod, the latter moves down with compression of the spring to strike the composite plate. For the air impact case, the initial impact force is lower than that for wet impact cases. Therefore, the redounding and landing force from the air impact is not large enough to overcome the spring force so that the rod cannot strike the plate again.
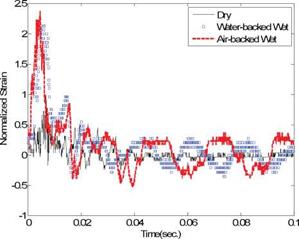
Because strain gage location #1 lies right underneath the impact site of the composite plate, the strains contain many higher frequency components compared to strains at other locations. A comparison of Fig. 5 to Fig. 6 shows that the peak values of impact forces and strains at position #1 occur simultaneously. Strains under wet impacts are more than double the dry impact strain at location #1. This ratio of peak strains between the wet and dry impacts is even greater than that of the impact forces.
|
Fig. 6. Comparison of strains along x-axis at position #1 among dry, water-backed and air – backed wet impact cases |
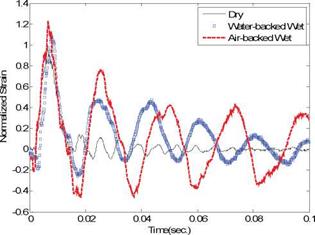
The differences between the wet and dry impact strains are smaller at the gage location #2 than those at the location #1. The strains under the air-backed wet impact are 20% and 50% greater than the dry impact strains along the x-axis and у-axis, respectively, as shown in Fig. 7. On the other hand, the water-backed impact results in 10% and 20% greater strains in the x-axis and у-axis, respectively, than the dry impact. The gage location #2 is closer to the clamped boundary in the у-axis direction. Thus, this suggests that the clamped boundary results in a greater FSI effect on the composite plate. Both wet impact strains show initial compressive strains before much larger tensile strains. Furthermore, these strain measurements show a clear difference among the response frequencies due to the added mass effect. Comparing the wet impact responses to the dry impact response, the response frequencies under the wet impacts are less than a half of the dry impact response frequency. Such a drastic reduction is caused by the light composite structure which is only about 1.6 times as heavy as the water. The response frequency is higher for the water-backed wet impact case than for the air-backed wet impact case by approximately 20%. This is an interesting result because the water-backed wet structure is expected to have a greater added mass effect with a lower response frequency. However, as expected, the decay of the strain peak values is greater for the water-backed wet impact case than the air-backed case. For example, the average damping ratio is 0.053, 0.062, and 0.11 for the dry, air-backed, and water-backed impact cases, respectively. This means the damping effect is the greatest for the water-backed case.
Calculation of the Added Virtual Mass Incremental Factor (AVMIF), в from Eq. (1) given below, yields approximately 6.5 and 11.5 for the water-backed and air-backed wet composite plates, respectively.
= 1
md V1 + в
|
|
|
(b) Strain along y-axis
Fig. 7. Comparison of strains at position #2 among dry, water-backed and air-backed wet impact cases
where m is the frequency and subscripts w and d denote the wet and dry cases, respectively. AVMIF represents the ratio of the kinetic energy of the water to that of the composite plate. The AVMIF for steel submerged in water ranges from 1.4 to 2.4 depending on the boundary conditions [Fu & Price, 1987; Haddara & Cao, 1996]. Comparison of AVMIF between the composite and steel shows clearly a much larger effect of FSI on the composite than steel.
The strain gage readings at gage location #3 have similar response characteristics as observed in the gage at location #2. Both air-backed and water-backed wet impacts resulted in 30% greater strains in x-axis than the dry impact. Because the gage location #3 is on the diagonal direction, strains in the у-axis were very close to those in the x-axis.
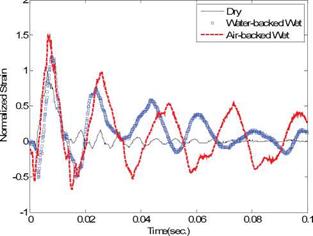
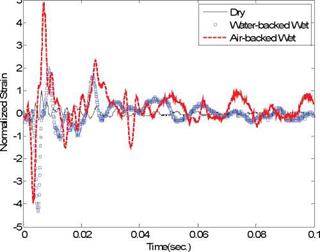
The effect of FSI is very significant for the strain gage reading at location #4, as shown in Fig. 8, and the strain readings are much less harmonic with more constraint effects from the clamped boundaries of the plate. First of all, both wet impact cases result in very large initial compressive strains compared to the dry impact case. The initial compressive strains are due to the clamped boundary conditions. After following the initial large compression, the air – backed wet impact case shows another large tensile strain while the water-backed case has a modest magnitude of tensile strain. The water on the backside of the water-backed composite plate seems to prevent further tensile strain at this gage location. The magnitudes of the strains at the gage location #4 are 4 to 5 times higher for the wet impact cases.
|
Fig. 8. Comparison of x-strains at position #4 among dry, water-backed and air-backed wet impact cases |
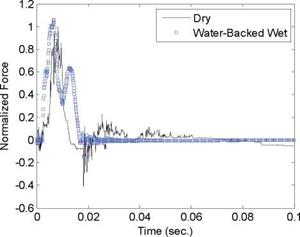
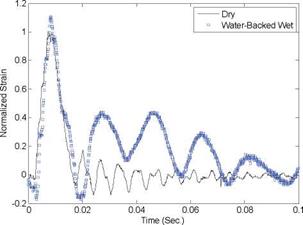
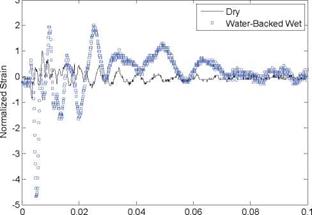
In the next set of studies, the impact height is reduced to 0.76 m while the impact mass remains the same. This represents the impact energy reduction by 29%. Both dry and wet impact tests are undertaken with the reduced impact energy. Interestingly, as the impact energy is reduced, the peak forces under the dry and wet impacts are almost the same even though the force-time histories are different as shown in Fig. 9. However, comparison of strain responses between the dry and wet impact cases is similar between the two different impact energy conditions. For example, Figs. 10 and 11 are the strains at the gage locations #2 and #4.
|
|
|
|
Time (sec.) Fig. 11. Comparison of x-strains at position #4 among dry and water-backed wet impact cases with a 29% reduced impact energy |

