Scarf joints are fabricated using carbon-fiber and fibreglass plain weave composites. Carbon – fiber is T700 while fibreglass is E-glass. The Derakane 510A ester resin is used as the binding matrix material. The scarf joint specimens are fabricated using the VARTM technique. After the base plate is fabricated using VARTM, it is cured for 72 hours before the joint surface is sanded down and then cleaned with acetone in preparation for creating the patch part using VARTM again. Four different combinations of scarf joints are fabricated and their strengths are compared. The constructed scarf joints are carbon base/carbon patch composite joints, glass base/glass patch composite joints, carbon base/glass patch composite joints, and glass base/carbon patch composite joints. The difference between the last two joints is illustrated in Fig. 3. In addition, scarf joints are fabricated either using the piece by piece as shown in Fig. 2 (called two-step cured process) or all together (called co-cured process). The latter case is not practically common but used to compare the scarf joint strength between the two fabrication processes. Because fracture of the scarf joint is a mixed mode fracture, specimens are also fabricated to test Mode I and Mode II fracture strength, respectively. To this end, single edge crack beams are made and tested. The Mode I fracture is tested as the double cantilever beam as shown in Fig. 4 while Mode II fracture is tested as the three-point bending beam as seen in Fig. 5.
The critical energy release rate for Mode I fracture is computed using
where P is the load when the crack propagates, 5 is the tip displacement, b is the sample width, a is the crack length, and Л is the horizontal axis intercept from a vs. C1/3 curve. Here C is the compliance of the double cantilever beam (ASTM, 2002). No applicable ASTM Standard exists for pure Mode II fracture toughness testing. Mode II testing consists of a three point bending test as shown in Fig. 5. Because the crack lies in the midplane of the beam, only shear stress is applied to the crack. The following equation is used to determine Mode II critical energy release rate, Gnc (Todo et al., 2000):
 |
where P is the critical load when the crack propagates, C is compliance, a is the initial crack length, Ъ is the sample width, and L is a half of the span length.
(a) carbon base/glass patch scarf joint (taper ratio=L/t)
Glass Composite Carbon composite
_____ і_____ _________________ _____________ і_______
(b) glass base/carbon patch scarf joint
 |
Fig. 3. Difference between carbon base/glass patch and glass base/carbon patch scarf joints
The experiment is conducted using Instron 4507. The specimens are measured and placed under an axial load until failure. In order to avoid buckling of the specimen without using any anti-buckling guide under compression, the unsupported length to thickness ratio is between 15 and 20. Both force and displacement are recorded. Scarf joint specimens fail at the interface. Some specimens fail through the joint interface as shown in Fig. 6(a), and others start the failure at a tip of the joint interface and are fractured across the cross-section of the joint as seen in Fig. 6(b).
|
|
(a) (b)
Fig. 6. Joint failure (a) through interface (b) across the joint cross-section
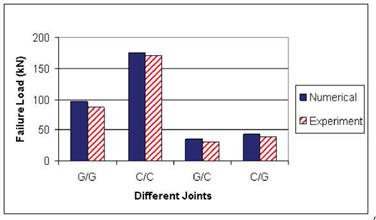
The compressive joint strength of the four different scarf joints is compared in Fig. 7. As expected, carbon base/carbon patch composite joint is strongest. Furthermore, the homogeneous scarf joints made of the same materials are stronger than the hybrid scarf joints made of two different materials. Especially, the glass base/carbon patch composite joint is the weakest.
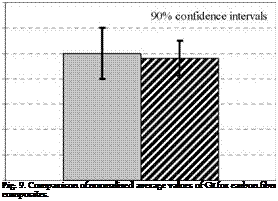
Another comparison of compressive failure strength is made between the two-step (or called 2-stage) cured and co-cured (or called 1-stage cured) scarf joints. Figure 8 shows that the 2- stage cured joint is stronger than the 1-stage cured joint made of carbon base and glass patch. It is believed that the preparation of interface surface for the 2-stage cured specimens (i. e. sanding and cleaning with acetone) contributes to the enhancement of the joint strength compared to the 1-stage cued specimens. Another study compares the Mode II critical energy release rates between the two-step cured and co-cured interface of carbon/carbon composites using the three point bending test as shown in Fig. 5. The results also show that the two-step cured samples have a larger critical energy release rate than the co-cured samples, which is plotted in Fig. 9.
|
Fig. 7. Comparison of failure loads of scarf joints made of different combinations of composite materials under compressive load (G: Glass-fiber, C: Carbon-fiber) |
 |

 |
0.4 Z
0.2 0.0
Two-Step Cured Co-Cured


