The fatigue-crack growth prediction models usually employ the following Paris power law due to its simplicity (Pook, 2000). In this work, Paris law is used to study the fatigue behaviors of cracked plates:
Ц = C(AK)m (7)
The so-called material constants, C and m, for 6061-T6 aluminum alloy, are C=1.8404 10-9, m=2.3. The quantity AK is the stress intensity range. Predictions of the fatigue life of plate without patch can be made by numerical solution of the Paris law:
where Айі is the crack length increment.
The crack grows up in a stable way until the SIF reaches the fracture toughness, i. e. K > Ко At each calculation step the value of AK varies due to the crack growth which determines the transformation of the tension state at the crack tip. The loading condition, considered in this study, is characterized by omin = 0, with tension ratio R = 0, then AK is simply equal to Kmax: namely the SIF value corresponding to the K* analytically or numerically calculated.
The value of AKi, is then corrected to take into account two phenomena that affect the rate of the crack growth: the closure of the crack and the static fracture (Pook, 2000).
Aa a crack cannot grow up when it is closed, AK becomes:
AKeff = к; – Kth (9)
where Kth is the material threshold value.
The crack growth rate depends on the value of AK which is function itself of the crack length. But the rate of the crack growth increases more rapidly when the critical condition of fracture is reached. In order to model the contribution of the static fracture the Eq. (9) is modified by the term Kfs:
AKeff* =AKeff+Kfs (10)
where
_ AKeff (11)
 |
|
Obviously the added term Kfs becomes more and more dominant as AKeff reaches the fracture toughness value.
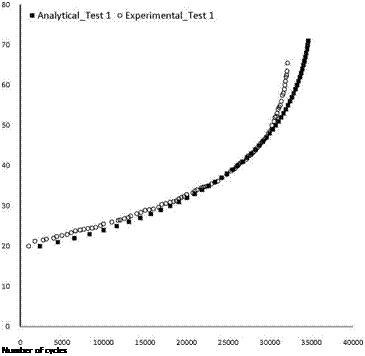
Fig. 3. The experimental and numerical fatigue life for the loading condition "Test 1′
Table 6 shows the analytical results of fatigue tests carried out for the three loading conditions. The number of cycles to failure is based on the Kmax criterion, i. e.when the Kmax reaches the fracture toughness Kc
|
Load [kN] |
Number of cycles to failure |
|
|
Test 1 |
14.71 |
34622 |
|
Test 2 |
22.o7 |
9658 |
|
Test 3 |
29.43 |
2267 |
|
Table 6. Fatigue life prediction of the cracked un-patched panel The Fig. 3 shows a comparison of the crack growth between the numerical model (Eqns. 711) and the experimental results for the cracked panel (without patch) under the loading condition #1. The details of the experimental measurements are reported in Section 5. The higher experimental crack growth rate at the number of cycles close to the failure is due to an asymmetric growth of the crack experienced during the tests. |


