Damage tolerance is an important parameter for the use of composite materials in technologically advanced sectors and in particular for military naval applications. This characterization involves drawing up a history of the damage kinetics of the specimens from initiation to complete failure. Several techniques are used to examine the extent of damage. First, during the dynamic compression high-speed photography and infrared cameras are used to follow the damage in the samples. Frames taken in real time are used to illustrate the evolution of the damage. Impacted samples are inspected by optical techniques and fluorescent dye is applied to improve damage visualization. The onset of macroscopic damage can also be located by the presence of a second peak on the s = f (t) curve. These various techniques make it possible to follow the macroscopic and microscopic damage.
The failure modes preserved in the specimens after mechanical loading at various impact pressures thus well define damage and failure loading history at high impact pressure. According to the results stated previously, it can be concluded that the damaging mode mainly depends on the fibre orientation and the loading direction without significant strain rate effect.
1.1 For in-plane tests
Based on the results obtained five damaging modes for 0°, 20°-30°, 45°, 60°-70° and 90° were determined. Figures 12 to 20 summarize the damaging modes for the various laminates. Each figure outlines the specimen’s history of damage initiation up to final failure.
In this section we will discuss the damage that occurs in dynamic compression for the various orientations. Through this analysis, we will establish a history of defect development in the samples until final failure.
a) For [0°]40 laminates
The damage for the [0]4o laminate occurs for an impact pressure higher than 1.4bar (S = 845 s-1). The damage is initiated by matrix plasticity, which can be detected on the a = f (є) curves, Figure 6. It is followed by cracks crossing the layers of the laminate and forming the letter V. The branches of the letter V are due to layer shearing. The shearing mode generates buckling of local layers and matrix cracks. After that, a delamination is initiated with the point of V followed by dilation in the transverse direction that involves a buckling of the external layers. At the end of dynamic compression, this buckling involves a delamination and a separation of several layer blocks. Figure 12 illustrates the evolution of damage.
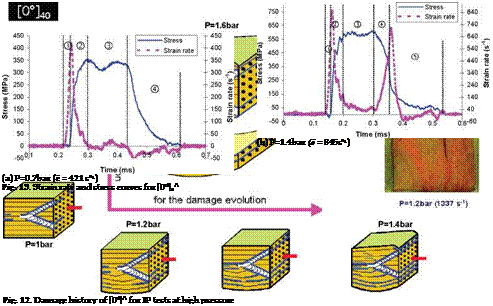
The macroscopic damage can also be detected by the presence of a second peak on the ё = f(t) curve. As shown in figure 13, a fall in stress occurs at the appearance of this peak, which is associated to the formation of the letter V and delamination on the external layers. In the curves describing the strain rate and stress evolution during the test, one can distinguish various zones, which can be summarized as follows: i. For non damaging tests, Figure 13a
– Zone ©: fast evolution of ё, which can be interpreted by the self-installation of the sample between the bars. Indeed, the parallelism of the sample facets in contact with the bars is not 100% guaranteed, which accounts for clearance and zero stress in this
zone.
– Zone ©: Once perfect contact is ensured, the strength of material generates a drop in є and an increase in a .
– Zone ®: evolution of a translates the incidental signal evolving around an average value with є tending towards a zero value. When є tends towards zero, the sample reaches maximum compression under maximum stress.
– Zone ©: in this zone, є changes sign whereas a starts to decrease; the specimen began to relax. This behaviour can be interpreted by the specimen springback, which is carrying out by an analysis of stereotypes taken by high-speed photography. At the end of this zone, the two signals are cancelled at the same time.
ii. For damaging tests, Figure 13b
– Zone © : same observations as for zone 1 of the non damaging tests.
– Zone © : Once perfect contact is ensured, material strength generates a drop in є and an increase in a .
– Zone ® : the stress evolution represents dynamic compression with a constant average value of a and є. In this zone, where a reaches its maximum value, more marked fluctuations compared to the non damaging test. One can explain this phenomenon by the appearance of the damage on a microscopic scale.
– Zone © : the accumulation of microscopic damage involves the appearance of a macroscopic defects. Inherent damage in the specimen generates a rapid fall in the stress with a rapid increase in є.
– Zone ©: the damaged specimen becomes more compact, which causes a sharp drop in є. In this zone, a always decreases but in a way less marked than in zone 4. One can note that the appearance of the damage brings about the disappearance of the springback behaviour.
b) For [±20°]20 and [±30°]20 laminates
The impact pressure 0.8bar corresponds to a critical phase where the kinetics of damage evolves differently; this is why the analysis for each laminate will comprise two parts:
i. Pressures lower than 0.8-0.9bar
For this range of pressures, [±20°]20 and [±30°]20 laminates undergo only "plastic deformations" which can be quantified in the same way as for the other laminates by analyzing a = f (є) curves. The damage for [±30°]20 laminate appears for lower impact pressures.
ii. Pressures higher or equal to 0.8-0.9bar
• In-plane view
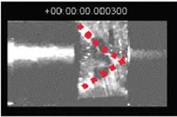
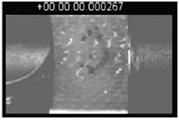
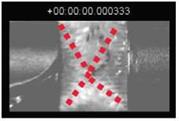
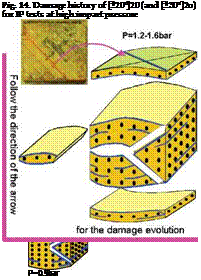
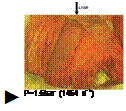
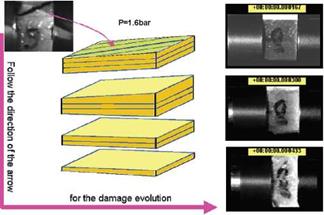
At the beginning, the compression wave generates a deformation on the entire sample. As compression evolves, one can see delamination, which occurs in the opposite sides of the sample. The size and the incidence of this damage become increasingly significant as a result of increasing pressures and they start to cross the sample starting from pressure 1 bar, Figure 14.
• Out-of-plane view
The first damage occurs in the layers plane. Indeed compression generates a crack along the diagonal of the external layers and can sometimes occur along the two diagonals. These cracks can cause the failure of the weft or warp yarns. Figure 14 illustrates the stages of the crack formation along the diagonal.
The same damage history occurs for [±20°]20 and [±30°]20 but the initiation is generated at a high impact pressure for [±20°]20.

|
|
||
|
|||
 |
|||
|
|||
 |
|||
 |
c) For [±45°]2o laminates
The damage for [+45°]20 laminates occurs for an impact pressure below 0.8bar. The damage is initiated by a crack forming the letter V. This shearing generates local layer buckling and cracks. Compression also generates a crack according to the diagonal of the external layers. The evolution of this compression generates substantial displacement in the thickness direction with a buckling of the external layers. This involves delamination and the final failure is caused by a separation of several layers block, Figure 15.
 |
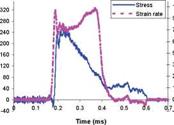 |
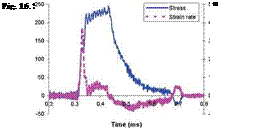
Figure 16 shows that stress falls with the appearance of a second peak. A comparison of figure 13 and 16 illustrates the difference between [0°]40 and [±45°]20 on dynamic behaviour and damage kinetics. The macroscopic failure is more brittle for [0°]40 than for [±45°]20 since the buckling effect is stronger (higher longitudinal stiffness) for [0°]40 laminates than for [±45°]20 laminates.
 (a) P=0.6bar (є = 369s-1)
d) For [±60°]20 and [±70°]20 laminates
The damage for [+60°]20 and [+70°]20 laminates occurs for an impact pressure between 0.7 and 0.8 bar.
i. Pressures lower than 0.7-0.8bar
For this impact pressure, slight plastic strain is detected by analyzing the stress-strain curves.
ii. Pressures higher or equal to 0.7-0.8bar
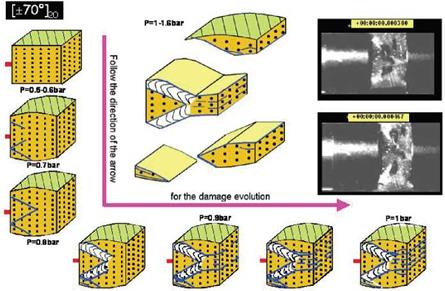
By analyzing the videos and frames it is of note that the dynamic compression of the samples can create three damaging modes independent of the strain rate.
• First damaging mode
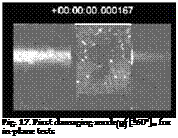
The sample undergoes plastic deformation at the beginning of the shock, then compression of the sample generates a damaged zone which has the shape of the letter V on the incidental bar side. The evolution of damage in this zone generates a shearing mode between the V zone and the rest of the specimen. Under the compression wave effect, there is a buckling mode of the external layers, which leads to local delamination at pressures between 0.8 and 1bar. This leads to a delamination of packages of layers for pressures from 1.2 to 1.6bar. At the same time, the penetration of the angular point of V generates delamination of the specimen in the transmitted bar side. Figure 17 shows the stages of damage.
• Second damaging mode
This mode begins with local plasticity followed by the generation of a V zone but on the transmitted bar side. The shearing mode propagates at the tip of the V domain along the two directions formed by the letter V. At the end of this propagation, a large deformation occurs transversally and generates layer buckling under the effect of the compression wave, which causes delamination, and separation of packages of n layers. Figure 18 illustrates the three stages of the evolution of the damage.
• Third damaging mode
This damaging mode seldom occurs, it begins with a local plasticity, as for the first two previous modes, followed by the formation of two V zones, one on the incidental bar side and the other on the transmitted bar side. This mode is the most severe of the three modes, this is why it can cause extensive damage even at relatively low impact pressures, Figure 19.
 |
|
|
|
||
|
||
|
||
![]()
|
|
|
|
|
e) For [90°]40 laminates
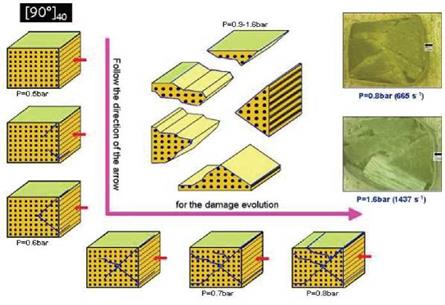
The damage for [90°]40 specimens occurs for an impact pressure higher than 0.6bar (ё = 587s-1). The damage is initiated by a crack crossing the laminate layers and forming the letter V. The branches of the letter V represent macro cracks, which continue to propagate through the layers. The final failure of the laminate is generated by these cracks. This failure involves the formation of several pieces of various dimensions, Figure 21. There exists a great difference between the damaging modes of [0°]40 and [90°]40. The failure of [90°]40 is abrupt without delamination or local buckling. The fall in stress is instantaneous.


