3.1 Tension and compression tests
In this section, tension and compression tests on a fibre reinforced composite are presented using the PDM algorithm. The lamina is formed by longitudinal glass fibres embedded firmly within an epoxy matrix. The material parameters for the tests are: Youngts modulus Ej =126GPa, E2 = E3 =11GPa, Poisson ratios v12 = v13 =0.28, v23 = v32 =0.4, v21 = v31 =0.024
normal strengths X11 =1950MPa, X22 = X33 =48MPa, and shear strengths S12 = S31 =79MPa. The load is a distributed force applied incrementally in parallel direction to the fibres up to complete failure, i. e. until the lamina can not withstand the load any longer. The load is applied over one of the sides of dimension 1 m x 0.1 m, whilst the opposite side is constrained in motion.
Charts represent the evolution of variables and parameters at the interior central point,
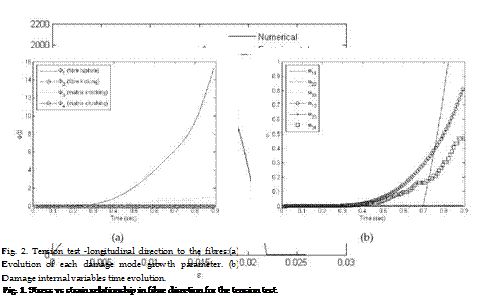
i. e. centre of mass. Figure (1) displays the stress vs. strain relationship from the numerical simulation and comparison with the experimental data for the tension test. A misplacement can be observed in the slope corresponding to the linear elastic behaviour. However, this is not sensibly affecting the overall response and, in particular, the softening response in the nonlinear inelastic regime in which the proposed model is focused. A numerical quantification of each damage mode are the internal variables Ф7 which represent the evolution of each damage mode. In other words, the evolution of Ф7 is a numerical quantifiable representation of the damage mode 7 allowing to know what are the magnitude of a particular damage mode and its relation to the remaining damage mode evolutions to be determined. It should be expected that the damage modes in tension would be fibre rupture and matrix cracking and, on the contrary, the damage modes that should evolve in compression would be fibre kinking and matrix crushing. This is what PDM detects efficiently as proved in Figure (2) for the tension test and, in Figure (3) for the compression test. This is an excellent characteristic of PDM as it permits the detection of the correct damage mode depending upon the stress state in corresponding region or domain. Thus, for example, Ф2 corresponding to fibre kinking damage mode should be zero as this type of failure is not possible in a tension test. Fibre
|
436 |
Advances in |
Composite Materials – Ecodesign and Analysis |
 |
|
Finite Element Analysis of Progressive Degradation versus Failure Stress Criteria on Composite Damage Mechanics |
437 |
|
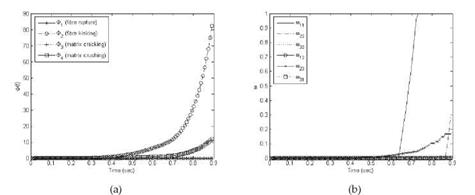
Fig. 3. Compression test – longitudinal direction to the fibres:(a) Evolution of each damage mode growth parameter. (b) Damage internal variables time evolution. |
rupture or breakage and matrix cracking are the only modes expected in a tension test. This is in agreement with the computational model output, see Figure (2a). Also, the internal variables шц shows how the different damage modes affect the degradation of the stiffness components (see Equation (4)). In Figure (2b), it is observed, as expected, that ш11 increases in an exponential manner. Eventually, it reached the maximum of 1 which is equivalent to complete failure.
In the compression test, the modes of damage obtained are fibre kinking and matrix crushing. This is in agreement with the mechanics of the composite as no other sort of damage should be observed in the centre of the sample in this test. As the failure is significantly affecting the longitudinal direction, again, the internal variable subjected to a higher rate of increment is ш11, see Figure (3b).


