In order to predict the strength of composite scarf joints, finite element based computer models are developed and assessed against the experimental data. Fracture mechanics based models are selected to predict the joint strength. A small size of crack is assumed at the critical location of the joint interface. The critical location is found using the finite element analysis without incorporating any crack. The critical location is located at a tip of the scarf joint interface, especially at the tip of the base material. A small crack is then considered at the critical location. The size of the crack is selected such that it is smaller than the minimum detectable size using the nondestructive technique. The "undetectable" crack length is generally considered as 0.254 mm or less. Therefore, the present computational models assume a crack no longer than 0.254 mm.
Because the size of crack is much smaller than the size of the specimen, a multiscale technique is adopted. The large scale analysis considers the whole scarf joint specimen as shown in Fig. 10 without a crack. Proper boundary and loading conditions are applied to the analysis model. The next small scale model considers only the region containing the critical location as indicated by lines in Fig. 10 and zoomed in Fig. 11. The size of the small scale model should be sufficiently greater than the size of the crack so that the boundary displacements of the small scale model are not affected by inclusion of the small crack. By doing so, the boundary displacements of the small scale model are obtained from the large scale model which does not include the small crack. Beside, the resin layer may be modeled discretely in the small scale model as shown in Fig. 11. Because the large scale model does not consider the resin layer, the resin layer vanishes at the boundary of the small scale model. A crack is embedded in the resin layer.
|
|
 |
Fig. 11. Small scale finite element model including the resin layer at the critical location and a small size of a crack (the triangular zone is the resin layer)
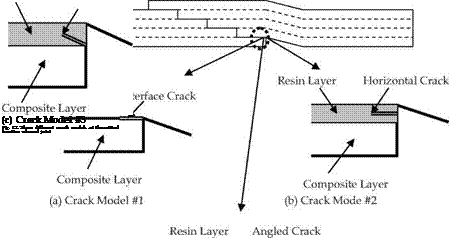
In modeling the crack, different kinds of crack models are considered and evaluated to determine what kind of crack model produces the results matching the experimental data [Kwon & Marron, 2009]. The first crack model assumes a crack at the critical joint interface without an explicit resin layer as sketched in Fig. 12(a). The second crack model includes a very thin explicit resin layer at the critical joint interface and assumes a horizontal crack in the resin as seen in Fig. 12(b). Finally, the third crack model is similar to the second model except that the crack is angled in the resin at the same slope of the scarf joint taper ratio L/t as shown in Fig. 12(c). The taper ratio is shown in Fig. 3. In Fig. 12(b) and (c), the resin layer thickness is exaggerated to show the crack clearly. The actual resin thickness in the model is 0.05 mm. For the second crack model, the crack is located in three separate places, respectively; at the resin bottom/composite interface, inside the resin, and at the resin top/composite interface. Figure 12(b) only shows the crack inside the resin. For the third crack model, only one crack is modeled. This crack is assumed to originate at the interface of the resin bottom/composite, as shown in Fig. 12(c). The angle of the slanted crack is 14.0o for the taper ratio of 4, and 7.13o for the taper ratio 8.
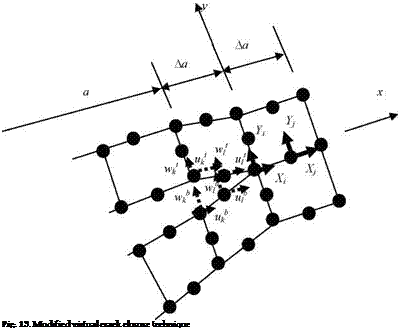
The Virtual Crack Closure (VCC) technique is used to extract Mode I and Mode II components of energy release rates from finite element fracture models. Two techniques have been explored for this study, the traditional VCC technique and the modified VCC technique. The modified technique gives results very comparable to the traditional technique, and saves significant amount of time while running the models. For this reason, the modified VCC technique is adopted for this study.
 |
The modified VCC approach uses the same information from a finite element analysis (i. e., nodal forces and displacements) as the traditional VCC method does. The former has its advantage over the latter because only one finite element solution has to be generated for the former while two finite element analyses are necessary for the latter technique. This can save an ample amount of time. When using the modified VCC technique, the elements at the crack tips must be equal in size to the virtual crack extension length Ая, as sketched in Fig. 13. The size Ая is usually assumed to be less than 5% of the assumed crack length. Furthermore, when using this method, it is assumed that this extension will not considerably change or alter the crack tip as the elements deform [Krueger, 2002]. Since the deformation is small, this is satisfied throughout the analysis.
 |
|
In calculating the energy release rates for Modes I and II, Gi and Gn, the following formulas are used for the modified VCC method following Fig. 13 notations:
 |
where u and w are the displacements parallel and normal to the crack orientation, and X and Y are the forces at the nodal points in parallel and normal to the crack direction. Subscripts denote the nodal positions and superscripts t and Ъ indicate the top and bottom nodes at the crack face as shown in Fig. 13. If there is no crack opening, Gi becomes zero.
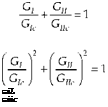
Because most cases studied here have both Mode I and Mode II energy release rates, it is necessary to use mixed mode fracture criteria. There are many different mixed mode criteria proposed so far [Reeder, 1992]. This study considers the following mixed mode criteria:
 (5)
(5)
(6)
in which subscript "c" indicates the critical energy release rate of each fracture mode. Equation (5) is called the mixed linear criterion, Eq. (6) the mixed quadratic criterion, and Eq. (7) the mixed biquadratic criterion which contains the interactive term, i. e. the second term. If the interactive parameter m is set to zero, it is the same as the mixed quadratic criterion. For linear fracture mechanics, the failure load for mixed fracture is computed as below for the three criteria. For the mixed linear criterion, the failure load is
![]()
![]() P = P
P = P
± fail ± applied i ^ ^ ^ ^
‘ Gt^Gtt + GunGT
Where Pfail and Papplied are the failure and applied forces, respectively. For the mixed quadratic and biquadratic criteria, the failure loads are computed from the following equations, respectively.
All three equations are explored in order to find the best result for the model. These results are provided later. In this study, the critical energy release rates were determined from pure Mode I or Mode II coupon testing, respectively. Their values are 307 N/m and 1280 N/m for Mode I and II, respectively.
In order to validate computational models, the models’ geometries are based on the test specimens. Those specimens consist of laminate plates with a scarf joint of length L at the center as shown in Fig. 3. A longer joint length yields a greater joint strength because of the larger joint surface area. Therefore, any general repair uses a large scarf joint taper ratio such as 10 to 20. However, such a large scarf taper ratio results in a large size of specimen which is not practical at the laboratory environment. As a result, a smaller taper ratio is adopted in this study for experimental testing in order to validate the computational models. One set of specimens are 227 mm long and 37 mm wide for the taper ratio L/t = 4 as shown in Fig.3. The glass composites are 7 mm thick and carbon composite are 5 mm thick with the overlap joint of four-steps. Another set of specimens have the taper ratio 8. In this case, the total specimen length is twice as long as the previous specimens with L/t = 4. Because of computational efficiency, 2-D plain strain models are considered instead of 3-D models.
The models consist of E-glass-fiber and carbon-fiber composites along with the vinyl ester resin. A previous study showed that either isotropic or orthotropic material modeling of the
2- D scarf joint produced almost the same results because the longitudinal modulus is the major load-carrying direction. Therefore, an isotropic material modeling is used in this study with the following material properties. Carbon composites have elastic modulus 52.4 GPa and Poisson’s ratio 0.34 while glass composites have elastic modulus 17.2 GPa and Poisson’s ratio 0.24. In particular, for a discrete resin layer modeling, the resin has elastic modulus of 8.34 GPa and Poisson’s ratio 0.28.
Each specimen is fixed at the left end while a tensile or compressive loading is applied at the right end. The axial loading is applied using a uniform displacement as conducted for the experiments. As a result, the axial displacement is applied uniformly to the right end of the specimen while its transverse displacement is constrained from any movement.
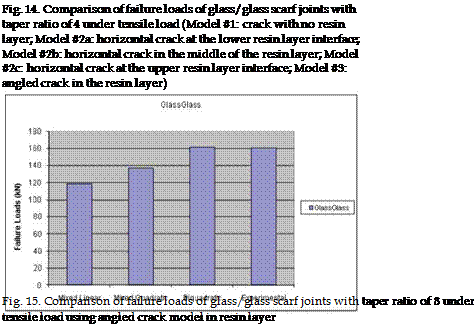
Results from various computer models are compared to experimental data for model validation. While tensile loading produces mixed mode of fractures (i. e. existence of both Mode I and Mode II) at the critical location where virtual cracks are considered, compressive loading yields only Mode II fracture because of crack closure. Therefore, the tensile load results are compared for mixed mode criteria as expressed in Eq. (5) through (7). The computer models are validated with the glass/glass scarf joint with a taper ratio of 4 as shown in Fig. 14. In the figure, five different crack models and three different mixed mode criteria are compared to the experimental data. Among the five cracks models, Model #1 in Fig. 12 does not include a discrete resin layer while the remaining four models consider a discrete resin layer only at the critical location as in Ref. [Kwon & Craugh, 2001]. Among the four models, three cases (Model #2a, 2b and 2c) consider a horizontal crack while one case (Mode #3) uses an angled crack. The horizontal crack is located at the lower side interface of the resin layer called Model #2a, in the middle of the resin layer (#2b), or at the upper side of the resin layer (#2c). As shown in Fig. 12, the angled crack with the biquadratic mixed mode criterion is closest to the experimental data. In the biquadratic model, the interaction parameter m is selected -1.3.
In order to further validate the selected model, i. e. the angled crack with a discrete resin layer along with the biquadratic mixed mode criterion with m = -1.3; glass/glass scarf joint with a taper ratio 8 is also analyzed and compared to the experimental data as shown in Fig. 15. The selected model produces the almost same failure load as the experimental data. The higher taper ratio yields a much closer result for the selected computer model. Because the angled crack has the same angle as the joint taper ratio, this crack orientation is considered to represent the actual crack growth direction well in the resin layer. That is why the angled cracks consistently predict joint strengths well.
The next set of validation is conducted for different composite materials under compression. As stated previously, compressive loading results in only Mode II fracture. Therefore, different mixed mode criteria cannot be evaluated for these cases. Instead, the selected crack model, i. e. the angled crack in a resin layer, can be assessed against the experimental data. The scarf joints are constructed using glass-fiber and carbon-fiber composites. The four different joints assessed against the experimental data are glass/glass (G/G), carbon/carbon (C/C), carbon/glass (C/G), and glass/carbon (G/C). As stated previously, the first material is the base and the second material is the patch added to the base material. Figure 7 shows comparisons of four different joints. The angled crack model in a resin layer produces consistently excellent predictions for the failure loads. The computer model slightly overpredicts the experimental results for all four joints.
In predicting the failure loads in all previous results, the same critical energy release rates for Mode I and Mode II have been used regardless of the fiber materials because the same resin material has been utilized. This means the failure at the joint interface depends on the fracture toughness of the resin materials. Therefore, modeling a resin layer at the critical location of the failure is essential to an accurate prediction of the failure load. In addition, the crack growth direction is affected by the taper ratio of the scarf joint. It is necessary to reflect the taper ratio in the crack orientation.

|
|
|
|
|
|
|
|
|
|
|
|
 |
|
|


