The compression and shear buckling analysis is made only for thin plates (with material characteristics presented in previous chapter). The geometry of the plates is square one, having the side length of 320mm, and total thickness of 4.96mm. The orthotropic directions (a), thickness of the macro-layers (t) and plate lay-up are presented in Table AA1.
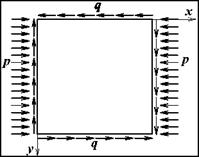
The constrains are considered according to plates type b from the previous chapter. The loading acting on the plate is according to figure AA9. For analysis the parametric calculus was done for various ratios a=q/p, that is {0.2; 0.4; 0.6; 0.8; 1}.
The all types of amplitude of initial transversal deformation are analysed.
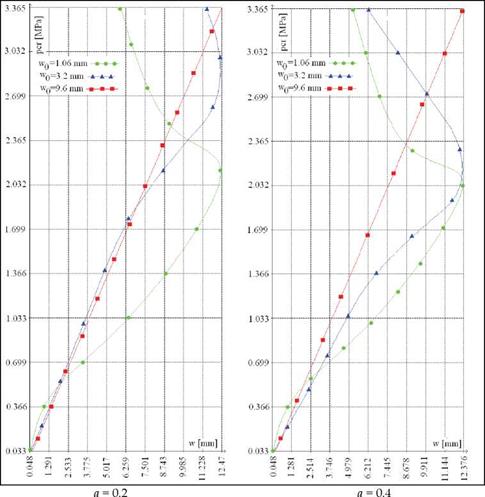
In the table AA3 the buckling loads so for perfect and for imperfect plates are presented. Only the cases of a=0.2 and a=0.4 are presented in figure AA10. As it is seen in figure AA10, according to the graphical method, the buckling loads for the all three imperfect plates are in the range 0.134MPa < pcr < 0.288MPa.
|
|
Fig. 17.9. Plate in shearing and compression
|
a=q/p |
w0=0 |
w0=1.06 mm |
w0=3.2 mm |
w0=9.6mm |
|
0.2 |
41.765 |
0.288 |
0.222 |
0.134 |
|
0.4 |
41.561 |
0.266 |
0.111 |
0.087 |
|
0.6 |
41.007 |
0.288 |
0.088 |
0.071 |
|
0.8 |
40.167 |
0.277 |
0.111 |
0.071 |
|
1 |
39.119 |
0.305 |
0.124 |
0.081 |
|
Table 17.3. Buckling load in [MPa] for shearing and compression loading of plate |
|
a=q/p |
Failure mode |
Perfect plate |
w0=1.06 mm |
w0=3.2 mm |
w0=9.6mm |
|
0.2 |
Tension |
2.499 |
0.706 |
0.605 |
0.403 |
|
Compression |
– |
1.413 |
1.312 |
1.211 |
|
|
0.4 |
Tension |
2.499 |
0.706 |
0.504 |
0.403 |
|
Compression |
– |
1.311 |
1.211 |
0.999 |
|
|
0.6 |
Tension |
1.874 |
0.504 |
0.504 |
0.302 |
|
Compression |
– |
0.908 |
0.876 |
0.802 |
|
|
0.8 |
Tension |
1.562 |
0.403 |
0.403 |
0.302 |
|
Compression |
– |
0.806 |
0.706 |
0.706 |
|
|
1 |
Tension |
1.249 |
0.302 |
0.302 |
0.302 |
|
Compression |
– |
0.706 |
0.563 |
0.563 |
|
Table 17.4. Buckling load (ultimate strength) in [MPa] for shearing and compression loading of plate |
As it is seen in figure AA10, the buckling load is decreasing since the magnitude of the transversal imperfection is increasing for all cases of loading ratios (see also table AA3).
In this case, the load capacity of the plate is decreasing since the transversal deformation of the plate is increasing. According to the nonlinear calculus (according to Tsai-Wu criterion), the ultimate strength is presented in table AA4.
The ultimate strength (pression corresponding to the first fail occurring) for perfect plates is greater than the ultimate strength of the plate with transversal imperfection.
In the central area, in the layers the compression fails occurs at an in-plane pression greater than the pression corresponding to tension fails.
|
|
The tension fails occur in a corner of the plate. On the other part, the compression fails occur in the central part (imperfection area) of the plate.


