The most used framing construction types for the ship deck panels made of composite materials are transversal or mixed. So, in this chapter the following case is presented (case of plates placed in the ship deck structure): plate placed between two pairs of parallel stiffeners (2 transversal web frames and 2 longitudinal frames, in the case of longitudinal framing construction system);
The geometry of the plates is square one, having the side length of 320mm, and total thickness of 4.96mm respectivelly. The orthotropic directions (a), thickness of the macrolayers (t) and plate lay-up are presented in Table AA1. The layers were grouped into the macro-layers (group of layers having the same characteristics: thickness (t), direction of fibers (a) and type of material).
The constrains are considered according to each plate. The degrees of freedom (displacements u and rotations r), considered to be zero are:
– on the sides parallel with x axis: uz, rx, ry;
– on the sides parallel with y axis: all d. o.f. (clamped side); uy, uz, rx, ry, rz (charged side).
The shape of the initial transversal deformation is considered as just the first form of the
buckling of perfect plate clamped on the sides (Figures AA2 and AA3).
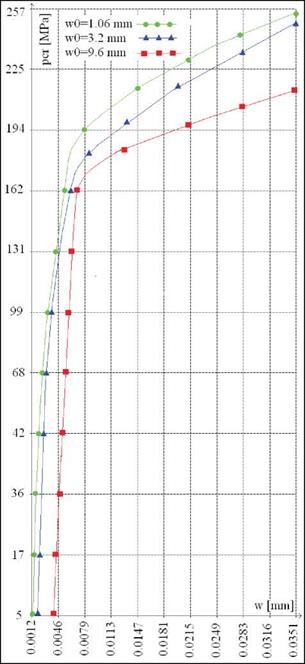
The analysis presented in this chapter is done for the most usual magnitudes (w0) of the transversal deformation of the imperfections (versus side length of the plate) occurred in the ship deck plates after fabrication. The following three cases are considered: w0=1.06mm (symbol 12); w0=3.2mm (symbol 32); w0=9.6mm (symbol 92).
In figures AA2 and AA3 the FEM model using shell composite elements is presented. In figure AA4, the variation of the transversal displacement of the middle point of the plate versus in-plane loading magnitude for the plate is plotted.
Since the plates have initial transversal deformation, as it is seen in the figure AA4 the increasing of the transversal deformation is starting from the beginning, which is so named buckling is starting as the in-plane load is starting to increase from 0.
|
|
|
Macro-layer |
a |
t [mm] |
|
1 |
2×00 |
0.62 |
|
450 |
0.31 |
|
|
2×90° |
0.62 |
|
|
450 |
0.31 |
|
|
2×00 |
0.62 |
|
|
2 |
2×00 |
0.62 |
|
450 |
0.31 |
|
|
2×900 |
0.62 |
|
|
450 |
0.31 |
|
|
2×00 |
0.62 |
Table 17.1. Plate lay-up
The explanation is that due to the initial deformation, the in-plane loading produces the compression in the plate and also bending in the area of imperfection. Therefore it is difficult to determine the buckling load by numerical way.
This is why we have chosen the graphical method, by drawing the asymptote to the curve in the area where the slope is changing almost suddenly.
The intersection of the asymptote with the loading axis can be considered as buckling load. Anyway the asymptote is not an unique one and we may determine the buckling loading in a range of values. Also, according to the curves the buckling load is decreasing since the amplitude of the imperfection is increasing.
So, as it is seen in figure AA4, according to the plotted asymptotes, the buckling loads of the pates are placed in the domain 140 MPa < pcr < 175 MPa.
On the other part, we can determine the behaviour of the plate after the buckling (so name post-buckling behaviour), to estimate the ultimate capacity (ultimate strength) using one of the failure criteria. So, the in-plane loading value of first fail occurring in the material may be considered as the ultimate strength of the plate.
In the studies described in this chapter, the occurring of the first fail was done according to the Tsai-Wu failure criterion. Due to the elasticity of the thin plate, no any fail occurs for the in-plane pressure increasing up to the 260 MPa.


