The geometry of the plates is square one, having the side length of 320mm, and total thickness of 4.96mm. The orthotropic directions (a), thickness of the macro-layers (t) and plate lay-up are presented in Table AA1. The layers were grouped into the macro-layers (group of layers having the same characteristics: thickness (t), direction of fibers (a) and type of material).
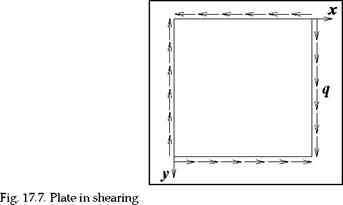
The constrains are considered according to plate presented in the previous chapter. The loading acting on the plate is according to figure AA7.
The all types of amplitude of initial transversal deformation have been analysis.
|
|
In the table AA2 the buckling loads so for perfect and for imperfect plates are presented.
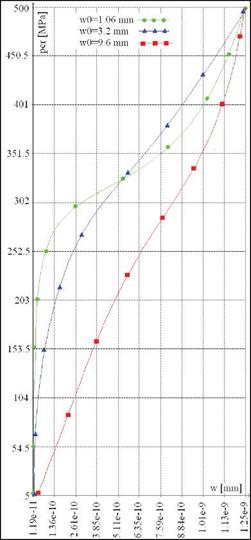
As it is seen, according to the graphical method, the buckling loads for the all three imperfect plates are in the range 104 MPa < pcr < 275.78 MPa. As it is seen in figure AA8, the buckling load is decreasing since the magnitude of the transversal imperfection is increasing. In this case, the load capacity of the plate is decreasing since the transversal deformation of the plate is increasing.
But, after the nonlinear calculus according to Tsai-Wu criterion, the ultimate strength, presented in table AA2, may be considered as buckling load, due to the fact the values of the ultimate strength are almost constant for all plates (15 MPa).
|
Failure type |
Perfect plate |
wo=1.06 mm |
wo=3.2 mm |
wo=9.6mm |
|
FAIL 1 (tension) |
20 |
15 |
15 |
15 |
|
Table 17.2. Shear buckling load (ultimate strength) in [MPa] |
|
Fig. 17.8. Shear buckling and post buckling behaviour of the imperfect plate |


