Two types of multiphase composite materials have been selected, namely; wood and ceramics. As it was mentioned in section 2, in particular we investigate the effect on thermal conduction due to structural morphology in woods and structural mineralogy in ceramics.
4.1 Woods
It is known that wood is a fiber-based ligno-cellulosic material (Avramidis & Lau, 1992). In this type of materials, the crystalline structure of cellulose chains may be altered, due to temperature variations, leading to a permanent loss in strength and considerable changes in physical behaviour including its ability to conduct heat. The purpose of this study is to investigate the relation between the thermal conductivity of wood and the various factors affecting this property. The transient hot-disk method was used at 20 degree Celsius to perform measurements of the thermal conductivity (A).
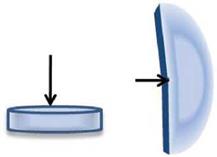
The investigated wood samples were hardwood from birch trees used for energy conversion purposes (approximate age of 10-15 years) with a stem diameter of approximately 100 mm. The samples were cut from the stem at a distance of one meter above the ground level. The samples were prepared from different stems, each sample consisting of two disks. Six samples were selected so that sufficient uniformity of density, grain size and orientation, and other physical characteristics could be obtained. The measurements were performed on this six samples on oven-dry basis at room temperature. To insure good thermal contact, in the experimental arrangement the sensor was clamped between the sample halves that consist of two identical cylinder-shaped pieces, each having a diameter of 30 mm and a thickness of 10 mm, see figure 1. The two disks that are required for each test sample were cut from successive portions of the same stem to obtain as much as possible identical and uniform characteristics. To study the influence of fiber direction on thermal conduction the disks were cut parallel (three samples) or perpendicular (three samples) to the fiber direction. Their surfaces were smoothened with sandpaper and equilibrated to the same testing laboratory conditions and then the measurements were performed along the prescribed directions. Although the theory of the TPS method is based on a threedimensional heat flow inside the sample, however, the samples were cut in a specified direction to maintain a unidirectional-measured property and to minimize any additional contribution of heat flow from the perpendicular directions to the assigned direction of measurement. By cutting the sample in a specified direction, it can be regarded as a unidirectional infinite medium if the time of the transient recording is ended before the thermal wave reaches the boundaries of the sample and produces edge effects. These measurements were done on the longitudinal (along the grain) direction and on the transverse direction (a combination of both radial and tangential directions to the annual rings), the arrows in figure 2 illustrate the measurements directions. Fan and his co-workers (Fan et al, 2006) proposed a fractal model based on SEM images to predict both the tangential and the radial effective thermal conductivities of wood. They used improved TPS method to validate the model, obtaining credible and precise results.
|
Fig. 2. Schematic drawing; the arrows indicate the longitudinal and transverse measurements directions, respectively |
All samples were oven-dried at a temperature of 120 oC until they reached a moisture free condition at constant mass. At a temperature of 120 oC both the free water and the bound water in wood are released, and thus the samples were completely dry. To prevent presence of any moisture, the samples were wrapped by Al-foil during the measurements and kept in plastic containers at all other times. Based on oven-dry masses and volumes, the average values of the apparent densities were calculated at the time of measurements for each sample.
Wood is a porous material and porosity is a parameter, which is likely to affect the magnitude as well as the temperature dependence of the thermal conductivity. This porosity r can be estimated using
P = 1- (Pave/Pth) (2)
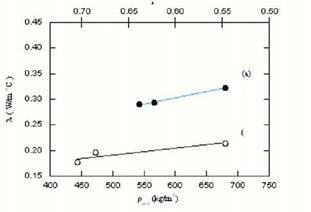
where pave is the average apparent density of the sample, pth is the assumed theoretical density of a compact solid wood free from voids. Its value is taken to be 1500 kg/ m3 (Kollmann & Cote,1968). The accuracy of the thermal conductivity data has been estimated to be better than 5%. Care was taken not to increase the temperature in the samples more than one degree Celsius. A larger temperature difference will mask any changes that occur in a narrow interval around a phase transition (Suleiman et. al, 1996). The mean values of five runs of X at 20 oC, are represented in Fig. 3 for both longitudinal (filled circles) and transverse (open circles) directions. The variations of the thermal conductivity X as a function of density and porosity are given by the lower and upper axis, respectively. The accuracy was within 35% for the conductivity measurements. According to the estimated porosity given in the figure, and considering the fact that the samples have similar thermal conductivity behavior in terms of their thermal profiles, the longitudinal /axial samples would be expected to have somewhat higher X-values than the transverse samples as shown in the figure. They exhibit the same behavior that of the density but with negative slopes as given by Eq.(2); the conductivity decreases as porosity increases. Although the few data points in the figure show the expected general trend for the conductivity, the figure does not explain why, at fixed temperature (20 oC), there is a difference in the slope as density increases or porosity decreases. Our discussion will be focused on X and its relation to microstructure (density and/or porosity) and anisotropy. The porosity is typically in the range from 0.5 to 0.8. Voids due to the porosity serve as scattering centers for phonons, and they take up a fraction of the heat conduction volume of the material leading to a lower thermal conductivity. From the present data related to density and porosity, the following can be deduced: Firstly, a density variation of 20% could alter the conduction by 15% as it is the case for the longitudinal direction at 20 oC. Secondly, the presence of other heat conduction obstacles in addition to voids, such as rays and cell boundaries could also affect the conduction process.
However, it seems that conduction through voids is the dominant factor influencing heat conduction in this type of wood samples. Peculiarities in bulk structure or inherent chemical composition of the different samples appear to have no influence upon thermal conduction, other than that due to the unique microstructure of each sample.
Regarding the anisotropic nature of wood there is no dispute about direction dependency of thermal conductivity in both hard and soft woods, see for example the review by Steinhagen (1977). Thermal conductivity in the longitudinal direction (parallel to the grain) is greater than conductivity in the transverse direction. This is may be attributed to orientation of the molecular chains within the cell wall. The long-chain linear polymers (cellulose) that comprise the cell wall, are arranged in bundles called microfibrils. These microfibrils are most closely aligned with the longitudinal axis of the cell. Obviously, the thermal conduction is higher along the length of a microfibril (parallel direction) than across a series of microfibrils (series direction), (Parrott & Stuckes, 1975).
|
Fig. 3. Thermal conductivity as a function of density (lower axis) and porosity (upper axis) in the longitudinal(solid circles) and the transverse (open circles) directions, respectively |
There might be some debate about the direction dependence of the transverse conductivity (the difference in conductivity between the tangential and radial directions with respect to the annual rings). Radial conductivity may be higher than the tangential conductivity and this may attributed to the influence of the radially oriented wood rays. According to Steinhagen (Steinhagen, 1977), it appears that the ratio of the tangential versus radial conductivity is primarily determined by the volume of the ray cell in hardwoods and by latewood volume in softwoods. However, in our case, no appreciable difference would be expected between the radial and the tangential conductivities, since our samples have a uniform structure throughout the annual rings Furthermore, our samples are cut from young trees, i. e. the samples are mostly free from latewood.
On the other hand, our data show a significant difference between the longitudinal and the transverse directions. This difference is expected to be larger than what we have measured. The reason for this is that, in order to satisfy the theoretical principle of the Hot-Disk
method and to maintain unidirectional measured properties, we have cut the samples in a specified direction, and this will not eliminate any contribution of heat flow from the perpendicular directions to the assigned direction of measurement. Thus, the resultant measured thermal conductivity in our case is an averaged value, which is lower than the actual value in the direction of measurement.
Kollmann & Cote 1969 model gives the effective thermal conductivity of a wood-like fibrous structure by using a weighting bridge-factor (4) between the two limiting cases of Wiener bounds. Namely: conduction in parallel layers (Xn) of gas, liquid and solid phases and serial layers (X_J in relation to the heat transfer direction. Furthermore, the model includes the influence of the radiation in the gas phase. According to this model, the effective thermal conductivity (Xeff) for pre-dried wood can be written as:
X ^ = 4K + (1 -4 )X
ХП = (1 – г)-X fiber + r(X + Xrad) (3)
X = 1 1 (1 – r) r
X fiber 1 ( Xg + Xrad )
where r is the porosity, Xfibern is the thermal conductivity of the cell-wall substance/fibers along the grain, Xfiber1 is the corresponding conductivity perpendicular to the grain, and Xg is the gas(air) conductivity. The irradiative thermal conductivity Xrad, at 20 oC, is very small and can be neglected.
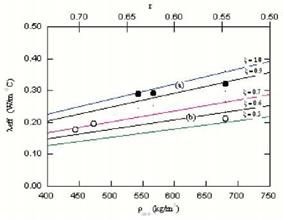
A plot of the effective thermal conductivity ( Xeff) for various values of the bridge-factor is shown in Fig. 4. This plot was generated by applying Eq. (2) and using Xg = 0.0258 W/m oC for dry air, Xfibern = 0.766 W/m oC and Xfiber1 = 0.430 W/m oC for the wood fibers at a density of 1500 kg/m3. The values of Xfibern and Xfiber1 have been used by Gronli, (Gronli, 1996) and were taken from mean values at room temperature reported by Maku, (Maku, 1954) and by Siau, (Siau, 1984).
|
|
Our data in the longitudinal direction at 20 oC lie in the range S= 0.8-1.0 The data in the transverse direction are in the range S= 0.5-0.7. At 20 oC, our values for both directions are in agreement with literature data. Gronli (1996) obtained S in the range from 0.8 to 1.0 for the longitudinal direction and in the range from 0.35 to 0.6 for the transverse direction. Kollmann et al.(1968) found S = 1 for the longitudinal direction and S = 0.58 for the transverse direction.
Furthermore, the model indicates an increase in the effective conductivity as the density increases or porosity decreases, which agrees with our interpretation regarding the influence of microstructure on the heat conduction in wood. Therefore, such measurements can be used to probe the effect of anisotropy (morphology) in wood samples.
It should be noted that there are some constraints imposed upon using this model, such a limited number of samples, using mean values for Xfibern and Xfiberl, and limiting the analysis to room temperature data. Such constraints may introduce a degree of uncertainty in the conclusions. However, there is a tendency of a good agreement between the measured and calculated thermal conductivities and the results are supported by prediction of the model proposed by Kollmann and Cote (Kollmann & Cote, 1968) in spite of the various assumptions involved. Furthermore, in this attempt the purpose of using this model for these six samples, just to examine the possibilities of determining the bounds for estimating the effective thermal conductivity.


