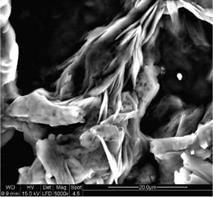
The three samples of cellulose fibers, L, H and U, were investigated by scanning electron microscopy (Fig. 2, 3a-c and 4). SEM image obtained for sample L (Fig. 2) revealed the distribution of fiber diameters ranging from 5 to 20 pm. The surface of L is smoother and the aspect ratio l/d of 4 to 14, greater then the l/d of MCC sample, ranging from 2 to 4.
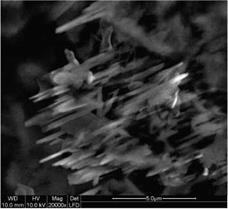
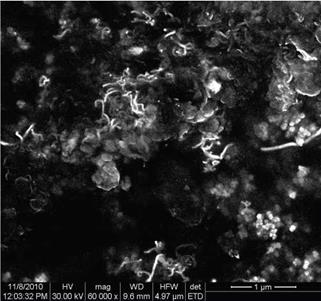
The acid hydrolysis of MCC is a heterogeneous process which involves the diffusion of acid into the cellulose fibers, and the subsequent cleavage of glycosidic bonds. Figures 3a-c are SEM micrograph of acid treated MCC after different time of acid hydrolysis (2, 4 and 5 hours). Fig. 3a shows how the acid broke the MCC particle, attacking amorphous areas and releasing aggregates of cellulose microfibrils. Fig. 3b shows that a big fraction of amorphous areas were entirely destroyed and cellulose crystallites in needle form released. Portions with agglomerated microfibrils could also be observed.
|
|||
|
|
||
|
|||
|
|||
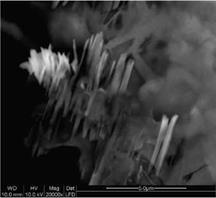
In Fig. 3c rod like cellulose microfibrils with diameter of 100 – 400 nm and aspect ratio of 10 to 20 are observed. Cellulose fibers with smaller diameters can not be detected in SEM images, at this magnitude. It is presumed that the further ultrasonic treatment destroyed the agglomerates.
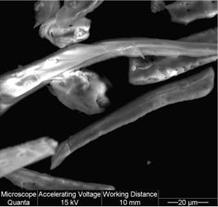
SEM micrograph of U type cellulose fibers (Fig. 4) shows that MCC particles are entirely disintegrated into fragments with different shapes and size by sonication treatment. The effectiveness of MCC defibrillation process is very high, particles and fibers with a diameter of 20 – 800 nm being observed. Individual particles but also large aggregates of cellulose fragments can be easily observed. It is possible that a re-aggregation to take place, promoted by the strong hydrogen bonding between the individual cellulose whiskers prepared by ultrasonication. The heterogeneity of shapes and size is very great in this sample because of the high energy involved in ultrasonication, so that o separation process was imperative for removing higher size aggregates of cellulose fibers.
|
Fig. 4. SEM image of cellulose fibers prepared by ultrasonication |
X-ray diffraction patterns of MCC and cellulose fibers (L, H and U) are shown in Fig. 5. The characteristics peaks originated from cellulose I are visible for all the samples at the same values of 20 (17.3°, 18.9°, 26.2°). These values correspond to the interplanar spacings of the three principal planes (101), (101) and (002) of the monoclinic unit cell of cellulose: d101 = 5.99 A, d101 = 5.40 A and d002 = 3.95 A, respectively. Very close values for 20 were reported by Lee et al. (2009b) taking into account the different wavelength of CuKa radiation used. In the case of sample L the two first peaks are not separated forming a broad peak, probably because of the more complex structure of sample L which contain beside celluloses, hemicelluloses and lignin.

