A further study of glare is done using different specimens, to obtain a material that minimizes construction costs and has required characteristics. Laminates have been designed to study the propagation mode of the crack, and in these specimens the fibres are not in the direction of maximum strength to promote the investigated damage. 12 specimens are built, and are divided into:
• Nr. 6 specimens with configuration [±30/90/Al/90/±30]: 6+1 layers, 6 unidirectional layers (fibreglass) with a quasi-isotropic configuration, 1 aluminium sheet type 6061-T6 (thickness 1mm) and total thickness is 3 ± 0.1 mm.
• Nr. 6 specimens with configuration [±30/Al/90]s: 6+2 layers, 6 unidirectional layers (fibreglass) with a quasi-isotropic configuration, 1 aluminium sheet type 6061-T6 (each thickness 0.6 mm) and total thickness 3.1±0.1 mm.
Figure 13 shows the detail of frontal view, while the figures 14 and 15 show side views (profile) of the two specimen types, from those it is possible to see the sequence of various packaging types. The aluminium sheet is clearly visible in a central position in fig. 14, while the two aluminium sheets are visible in fig. 15.
|
Fig. 13. Front view of specimen |
|
Fig. 14. Side view of specimen (type a) |
|
 |
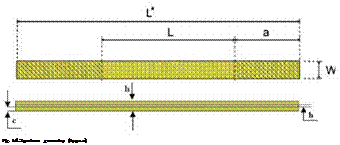
The choice of these configurations has been made to have the specimens with similar thicknesses. Specimens geometries are shown in figures 16 and 17, and the size are listed in the table 3.
Г
г
Fig. 17. Specimen geometry (type b)
|
Specimen |
No. |
W |
L |
L* |
a |
b |
c |
h |
|
types |
tests |
[mm] |
[mm] |
[mm] |
[mm] |
[mm] |
[mm] |
[mm] |
|
(type a) |
6 |
25,5 |
120 |
230 |
37 |
1 |
1 |
3 |
|
(type b) |
6 |
25,5 |
120 |
230 |
37 |
0.6 |
0.6 |
3 |
|
Nr. test |
Initial load [N] |
|
|
Glare (type a) |
Glare (type b) |
|
|
1 |
6,67 |
8,7 |
|
2 |
17,3 |
16,1 |
|
3 |
28,8 |
30,3 |
|
4 |
29,1 |
40,2 |
|
5 |
83,2 |
|
Table 4. Load imposed on Glare specimens (of course some tests are discarded because they are not reliable) |
Also fatigue tests in bending were done for specimen types and for different values of imposed displacement as table 4 shows.
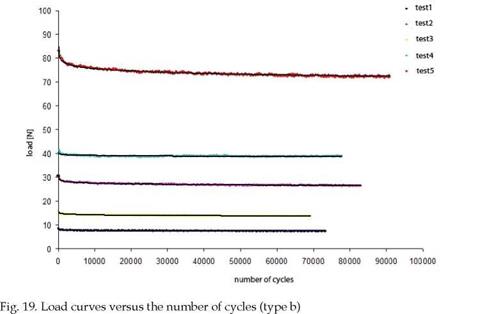
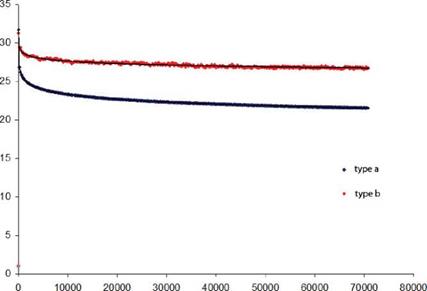
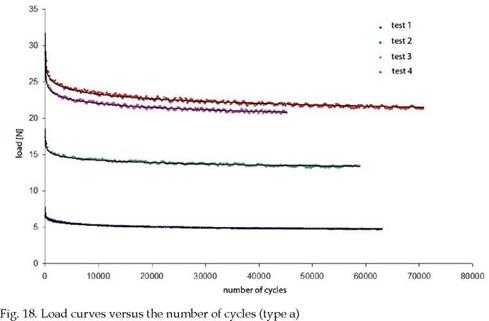
Figures 18 and 19 show the load curves versus the number of cycles, for the hybrid specimens with one and two aluminium sheets. It is possible to see as the damage is manifested in the first part of the curve mainly, which follows an asymptotic trend. Graphical comparison of experimental results gives an idea of the different behaviour that the two materials have during a fatigue load. The comparison of obtained results shows that the material type (a) has in initial phase a bigger damage than that of type (b) with similar displacements imposed (Fig. 20).
|
|

|


