The load values are monitored and registered by a dedicated acquisition system during the experimental tests. The whole system consists of a strain sensor (load cell), a strain indicator, a digital-analog connector and a computer. Special software, created and developed in LabView room, allows to record and display the values of variation of stiffness of the composite or the bonded joint, thus obtaining in real time the damage versus the time or cycles number. The decrease in stiffness is measured via the stress until specimen failure, operating with constant amplitude strain. Also it is possible to use any criterion of fatigue life of composite materials.
1.4 Setting machine
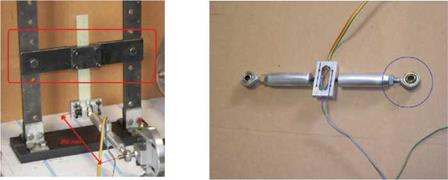
The device can perform tests under pulsatory or alternating loads with the "flexibility" of some organs. In particular, as shown in figure 4, it is possible to increase the maximum displacement imposed to the test clamped the bar in the back of the two standing by the change in the position of horizontal beam (which allows the grasping of upper specimen).
|
Fig. 4. Control system through horizontal beam (on the left) and joint (on the right) |
Another way to change imposed movement is provided by joint (Fig. 4 on the right). One or both of the joints are screwed or unscrewed to adjust the distance between the eccentric and specimen, so it is possible to vary the minimum (umin) and maximum (umax) imposed displacement. Also (Fig. 4 on the left) the distance between the eccentric and the system of lower grasping specimen is illustrated, approximately 250 mm. Critical value of possible strain (umax – umin) is 150 mm theoretically, equal to the sum of twice distance QP (fig. 2), crank radius formed by the eccentric with the elongation imposed at the joints.
2. Load cell
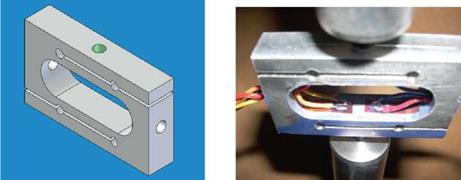
Load cell is constituted by a metal body that takes different forms according to the following requirements: amplitude of measured load; applications type; environmental conditions. Two cells for two different load values are designed: in aluminum (Fig. 5) for stresses not exceeding 50 N and in steel for stresses not exceeding 200 N. 3D solid modeling was obtained using Solid Edge, and analysis was performed by ANSYS to verify the design and the stress response of the transducer, obtaining the definitive optimized configuration. Operating with constant amplitude of deformation (strain control), the decrease in stiffness is proportional to the variation of the load recorded by the load cell, from the beginning of the test until the complete damage of the specimen.
Aluminium load cell just weights 25 g and is well suited for monitoring small loads; the demonstration is its resolution: 0.42 g. Four electrical strain gauges having resistance of 350 Q are placed in the hollow area; the basis of measurement is 3 mm. The transducer also has two holes M5 (top and bottom holes) to connect it to material testing machine and two side holes (radius 4 mm) to pass the cables connecting the strain gauges. Similar geometry to the aluminium transducer is used to realize the load cell in steel. Also in this case four electrical resistance strain gauges of 350 Q were used and the basis of measurement is 3 mm. Also in this second case the weight remains relatively low and is equal to 59.9 g.
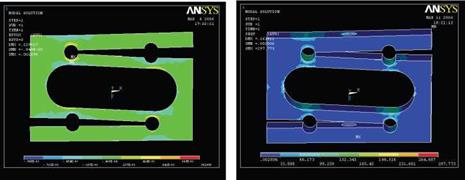
3D solid model obtained by Solid Edge has been imported into the finite element code Ansys. The analysis was performed to verify the size of transducer. Figure 6 shows the longitudinal strain, interesting four strain gauges on the cell subjected to load equal to 200 N and Von Mises stress map obtained by ANSYS, when load cell (steel) is subjected to a load of 200 N.
The maximum strain is obtained in closeness of the fillet radius and therefore the strain gauges are positioned in these areas. Static safety factor are obtained 6.3 for the aluminium load cell and 3.5 for the steel load cell by the numerical study in ANSYS.
|
Fig. 5. 3D model of load cell (9) (on the left) and positioning of strain gauges (on the right |
|
Fig. 6. Map of longitudinal strain (on the left) and of Von Mises stress (on the right) |
2.1 Load cell calibration
Calibration involves the recording of output signal by the load cells, when loads are known. The aim is to derive calibration curve, allowing the correction of the output signal by cells, in order to read the exact value of the load acting in every direction. A load varying between a minimum and a maximum is applied at predetermined intervals; the calibration has been performed at least twice to verify measurements repeatability: calibration curve is draw in the case of correlation of the two tests, otherwise the data are interpolated by Ordinary Least Squares and another test is run to confirm the results. Calibration methodology is shown in the EN 10002/3 and ISO 376 rules, which are international standards of reference.


