Specimens made of two aluminium layers 2024 T3 are used For MMELS tests (Mixed Mode End Load Split) and DP760 3M epoxy adhesive is used (Ducept, Gamby & Davies, 1999; Pirondi & Nicoletto, 2001).
|
epoxy adhesive |
2024 T3 aluminium alloy |
||
|
Shear strength [MPa] |
28.2 |
Ultimate strength [MPa] |
448 |
|
Peel strength [N/cm2] |
61.6 |
Yield strength [MPa] |
310 |
|
Compressive strength [MPa] |
78.8 |
Young modulus [MPa] |
73100 |
|
Young modulus [MPa] |
5972 |
Poisson Ratio |
0.33 |
|
Poisson Ratio |
0.4 |
|
Table 5. Mechanical and elastic properties |
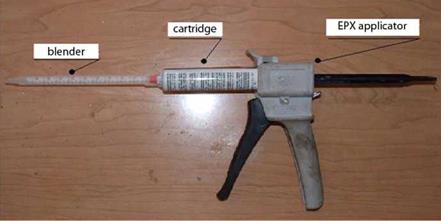
Epoxy adhesive is a bi-component product: the base (epoxy) and the accelerant (modified amine), it cures at room temperature and it has high temperature resistance (Higgins, 2000). The mixing ratio in volume of the two constituents is 2:1 and it is obtained through the use of 3M EPX applicator (Fig. 21). Table 5 shows the values of elastic properties and mechanical properties of the adhesive and of 2024 T3 aluminium alloy: The yield strength is the stress causing a permanent deformation 0.2%.
|
Fig. 21. EPX Applicator |
The curing time is influenced by temperature and air humidity greatly, and decreases with increasing temperature and humidity. The minimum time recommended by 3M is 24 hours at room temperature followed by treatment in the oven for 1 hour at 80±2°C with subsequent slow cooling. The thickness of aluminium sheet is 3 mm.
Tensile test is performed with a testing machine (Hounsfield) to determine elastic properties and 20 kN load cell is used. Studied model is MMELS; all the same changes of geometric nature are done on the model for workshop necessity.

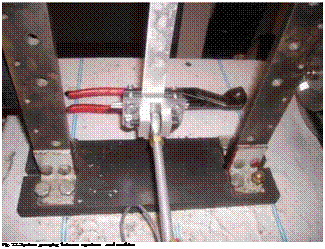
The first change is done to transmit the displacement to the model: loaded sheet is longer than discharged sheet. Figure 22 shows the detail of the grasping between the specimen and the lever that applies the displacement. The second change is imposed by the full-scale load cell. The length of the specimen is increased to avoid the plasticization both of the load cell and of the model in the joint and to avoid to impose very small displacements. Figure 23 shows optimal size of model, obtained applying the beam theory. Total thickness is B=20 mm, the thickness of loaded sheet is hi=1.6 mm, while the thickness of discharged sheet is h2=3 mm.
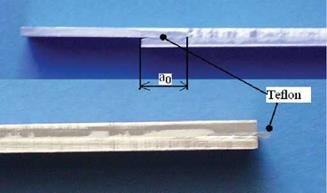
Initial crack was created by interposing a Teflon layer between the two adherents (Figure 24). The thickness of Teflon is 50 pm, and then 4 Teflon layers are interposed to have desired thickness of adhesive layer (200 micron).
Fig. 23. Experimental model, loading and constraint system used for experimental tests
|
Fig. 24. Teflon layer interposed between adherents to create desired thickness and initial crack |
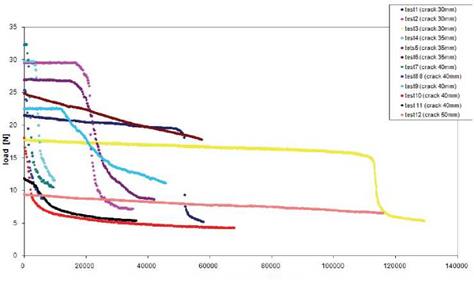
Figure 25 shows that the load evolution can be divided into three zones. In the first area the load has a decreasing trend with increasing number of cycles; the specimen accumulates a small damage at the apex of the crack. The second area shows a sharp drop in the load due to rapid damage to the area near the apex of the crack (unstable defect propagation). In the third phase there is a very slow crack growth, which continues until complete delamination. The study of different curves shows that the specimen accumulates damage up to the break during load cycles (Sun & Jih, 1987; Boniface & Simha, 1999).
|
a0 [mm] |
Imposed displacement [mm] |
Inizial load [N] |
|
|
30 |
A |
11 |
29,5 |
|
B |
8,5 |
21.8 |
|
|
C |
7 |
17.9 |
|
|
35 |
D |
12,5 |
29,8 |
|
E |
12 |
27 |
|
|
40 |
F |
17 |
32,4 |
|
G |
13,5 |
25,4 |
|
|
H |
9,5 |
17.9 |
|
|
50 |
I |
7 |
9.2 |
|
Table 6. Experimental tests Load-number of cycles curves were obtained (Fig. 25). |
number of cycles
 Fig. 25. Load-number of cycles curves of the bonded joints for different crack lengths


