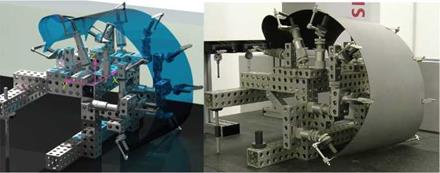
For example the procedure has been applied to the Mid Cowling, but the same should be applied to all the components of the winch arm. To be inspected, the Mid Cowling has to be mounted on a fixturing equipment that reproduces its assembly positions, see Fig. 5. Because it is joined to after and forward frames by means of special grub screws that are inserted in each component holes, the fixturing equipment has to reproduce the position of these coupling holes. Therefore, the fixturing equipment has to reproduce the three reference planes A, B and C in Fig. 4. The part may be connected to the equipment through pins with cone-shape heads that couple with the part holes and through blocking elements such as c-shaped clamps and springs. The pins allow to accurately locate the part holes inside the CMM working volume. Finally, to spatially orientate the elements of the equipment, ball-and-socket joints may be used. All the details on the design of the fixturing equipment may be found in (Ascione & Polini, 2010).
|
Fig. 5. Fixturing equipment of the Mid Cowling |
|
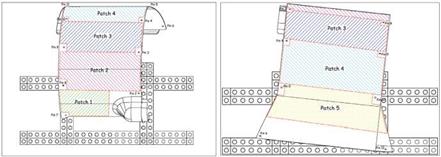
a) b) Fig. 6. Detected scan patches; a)top view; b) front view |
The force of 0.1N applied by CMM probe to the non-rigid freeform surface of the Mid Cowling does not produce a significant deformation. In fact, the maximum deviation is equal to 0.35 pm as shown in (Moroni et al., 2007), while typical value of profile tolerance in this kind of application is around 50 pm.
The deviation along the normal curvature of the surface of the part was calculated for each acquired point. The distribution of the deviations on the surface represents the overall error of shape. Such a value may be seen as the sum of three different contributions; the first due to component production process; the second due to the assemblage of the part and the third due to the measuring procedure. The deviation was calculated for each acquired point with Holos® measuring software.
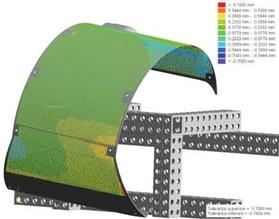
The data analysis has been performed on each patch extracted from the Mid Cowling. From the analysis of distance colour maps it is possible to observe that no systematic behaviour of the deviations is present (see Fig. 7).
To estimate the repeatability of the measuring procedure, the scanning on the 5 patches was repeated 5 times, maintaining the same Mid Cowling coupling position on the equipment. Therefore, the inspecting procedure may be considered the only responsible of variability of the measuring results. Then, the average deviation was calculated for each of the 50000 measuring points. Finally, the difference between each measurement point and the average deviation was calculated. The values thus calculated were distributed according to a Gaussian probability density function, as verified with the Anderson-Darling statistic test (p-value > 0.1).
The value of the overall repeatability of the measuring process, that has been calculated as the standard deviation of the sample of 250000 values, is equal to 8.5pm. This value is very small; this means to say that the effect of the inspection process on the measured deviation is indeed non significant.
The idea introduced in this work is that the displacement between the real part and the nominal one, obtained in the inspection process, may be used as input values for a structural numerical analysis with the objective to obtain the stress and strain fields induced in the material when the part is assembled in the final product. That is possible because the measured field of displacement represent the real configuration of the component in its assembly state. The inspection process simulate the assembly configuration of the real part; therefore, the measured displacements are the differences from the real part, assembled on the winch arm, and its nominal configuration represented by the CAD model. The measured displacements have been used as loads applied on the components in its nominal
configuration for the numerical simulation. In this way the results of the structural analysis are characteristic values of the assembled parts, since the assembly process locks the components of the assembly in the same way the assembly is bounded in the inspection process and in the numerical simulation. The numerical analysis has been carried out with the MSC_Patran/Nastran® software but, before implementing the real case simulation, an assessment of its capability on composite material has been required to obtain a validation of the results for our case. In this sense a matching procedure between experimental results and numerical results on the same material in the same configuration has been necessary.
|
Fig. 7. Chromatic mapping of the deviations between measured points and nominal geometry |
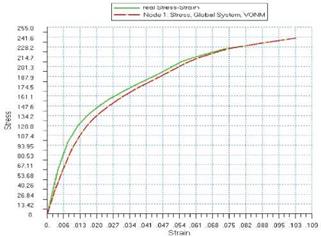
Having available experimental results for a tensile test on the composite material constituting the Mid Cowling, the matching procedure has been carried out by simulating the same test mean the numerical software and then comparing the obtained values with the correspondents of experimental test. All the details of the tensile test are reported in (Ascione & Polini, 2010). Fig. 8 shows in blue the stress-strain curve obtained from the analysis for the first node of the mesh (the node at the intersection of the two plane of symmetry) and in green the stress-strain curve for the experimental test. It is possible to see that the results obtainable with the used numerical software on the considered material are reliable.
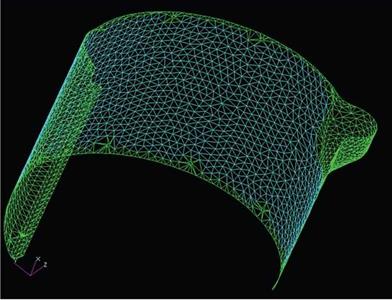
The same procedure used to simulate the tensile test has been performed to model the Mid Cowling. In Fig. 9 it is possible to see the finite element representation of the Mid Cowling, where triangular shell elements have been used to replace the continuous geometry. In this case triangular elements have been used, since this kind of elements is the best approximation of the distribution of the displacements measured through the inspection process. In Fig. 9 there are green and light blue elements, since the green elements represent the part’s geometry, while the light blue elements represent the points where the displacement has been applied. Further details on the setting of the numerical analysis are deeply described in (Ascione & Polini, 2010).
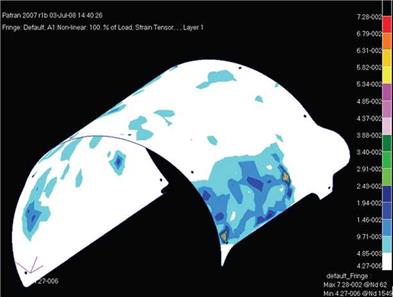
The results of this simulation have been the stress and strain fields induced in the Mid Cowling subjected to the loads explained above. The strain field is showed in Fig. 10. The values of the strain showed in these results are congruent as magnitude with those ones of
the tensile test and with the values of the displacements imposed as loads. Therefore, it is possible to consider the obtained values representative of the real state of the component in its real configuration of assembly. The maximum value of the strain field is about 7.28 pm that is very smaller than the applied tolerances. Therefore, the Mid Cowling may be considered as a rigid part for the tolerance analysis.
|
Fig. 8. Stress-strain diagram with green curve for the experimental test and with red curve for the numerical results |
|
|
|
Fig. 10. Strain field resulting from the FEM Analysis of the Mid-Cowling. |

