Erik Dahlquist, Brian Hunt, and Toni Ivergard
CONTENTS
8.1 Cases of Control Centres, Displays, Functionality, and Layout……………. 203
8.1.1 Some Experiences from the Field………………………………………………… 206
8.1.2 Future Trends………………………………………………………………………………. 210
8.1.3 The Control Room as Part of an Integrated Process Design:
Stora Enso………………………………………………………………………………. 211
8.2 Control Rooms for Power Generation and Distribution…………………………. 212
8.3 Trading of Energy and Environmental Issues……………………………………….. 216
8.3.1 Growth and Development of the Trading and Brokerage
Industries………………………………………………………………………………… 216
8.3.2 Traditional Models of Trading and Brokerage and Emerging
Trends……………………………………………………………………………………… 217
8.3.3 Trading and Brokerage of Energy: Vattenfall……………………………. 218
8.3.4 Vattenfall and the Role of Trading…………………………………………….. 219
8.3.5 Control Centres for Energy and Environmental Trading……………. 220
8.3.6 Energy Trading, Ethics, and the Environment……………………………. 222
8.3.7 ‘Carbon’ Trading: Sometimes It Pays to Pollute………………………… 222
8.3.8 Conclusions………………………………………………………………………………… 224
8.3.9 Proposals…………………………………………………………………………………….. 224
References and Further Reading………………………………………………………………………… 226
8.1 CASES OF CONTROL CENTRES, DISPLAYS,
FUNCTIONALITY, AND LAYOUT
A hundred years ago, control rooms looked beautiful with all copper and brass shafts and wheels, and mechanical displays. During the 1970s and 1980s computerisation and standardisation became the norm. Every part of an industrial plant had its own control room. Everything possible was displayed and logged, and enormous amounts of data were stored in files. Proportional, integrational, differential (PID) controls were implemented on a large scale, and alarms were installed on an equally large scale (Figure 8.1).
The final years of the 1990s and the beginning of the twenty-first century saw a centralisation of the control room operations so that the number of necessary control rooms was often reduced to only one or two in a complete industrial plant. No
|
FIGURE 8.1 The control room at Vasteras old power plant (around 1920). |
longer are operators handling a small part of the plant that they know in great detail. Instead they work in teams who cover the complete plant, or at least major parts of the plant.
This change in control room focus also brought about changes in the need for much more automatic controls and decision support tools. It is not enough to collect a lot of data. What is important is to be able to make use of these data to enhance the production, minimise the quality variations, minimise shut downs, avoid environmental harmful emissions from the plant, reduce risks for accidents, and so forth. Commercial pressures mean that all this should be done with fewer people. From a situation where the focus was on local displays for a smaller part of the plant, organisations now need a control room where small displays interact with large displays and with possibilities for conferences to share and exchange information, and a pleasant environment for the operators.
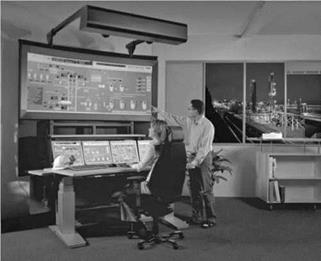
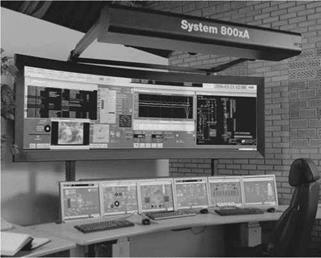
One of the leaders in this area is the multinational conglomerate Asea Brown Bouverie (ABB). They have created a concept where a few separate computer displays on a desk can be lowered or raised as needed by the operators. Above the desk are a number of large displays. There is no possibility for the operators to walk between the desk and the large screens, as this might block the visibility of the screen for the other operators. ABB realises that it is also important to have information displayed on such a scale to be readable from a distance. When a particular operator is working with data in the smaller displays and needs a second opinion from colleagues, the operator can bring up that part of the process on the large display. Everyone in the room with relevant knowledge can contribute to the discussion. When the operators need more information to solve a problem, the technology can also display images from cameras or videos situated within the plant.
On the smaller displays it may be possible to display, relatively easily, a whole section of the plant from one end to the other. This is much better than having a series of very small pictures to provide an overview. Data can also be combined by displaying the process flow sheet on the large screen while trend displays are displayed on the small screens (Figure 8.2).
|
FIGURE 8.2 Modern control: The demonstration system at ABB. |
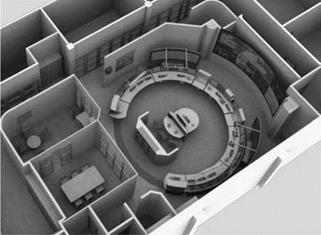
When the operators need to sit and discuss problems, they are able to do this alongside the displays at conference tables (Figure 8.3). These tables intended for conference meetings have been designed into the layout of the control room and are thus adjacent to the data displays. Restrooms and similar facilities are close so that operators can be brought in quickly when needed. An example of such a modern control room design is shown in Figure 8.4.
Formerly, everyone using a computer screen received the same information from the computer system (Figures 8.5 and 8.6). Nowadays, a new trend is to personalise the displays. This is important because each individual person or team should receive the information relevant to his or her particular role in the plant operations. The maintenance people should get the information relevant for service and maintenance, the production manager should get the overall picture that is relevant for the planning of the whole process, and the process engineers should have the possibility to go into deeper depth of the process information system to develop the process or diagnose the process performance. For the management it may be no technical information at all but only some key information about process stability, mainly focusing on production level, quality, material flow, and similar tasks, as well as order booking and deliveries.
This differentiation has both advantages and disadvantages depending on the perspective. It may give the possibility to differentiate the information so that different operators have their own displays. This has the advantage to make each operator happy, but the disadvantage is that it may be more difficult to operate the plant in the same way for different shifts if everyone is allowed to modify the information he or she should retrieve. So decisions must be made on a strategic level about what differentiations may be allowed and what needs to be standardised.
|
FIGURE 8.3 Large screen used to show details for a large group so that discussions can be made to solve problems together. |
|
FIGURE 8.4 Modern control room layout at ABB. |


