Due to the complexity of the pulping process and the dynamics of the paper production process, process control systems have widely been established in the pulp and paper industry. For a typical application the number of the input/output (I/O) connections can vary between 30,000 and more than 100,000. In most cases conventional control technology is used. Operators see the actual values displayed on process displays, proportional, integrational, differential (PID)-controllers help to operate the plant.
Various approaches can be followed to manage these complex systems in an optimal way. The first issue to be addressed is how to handle the huge amount of data available within the system. Fast data acquisition, high-dimensional data analysis, and dimensional reduction play a major role in providing the right data set. In addition, new sensors that have become available within the past few years have to be evaluated as additional sources of information.
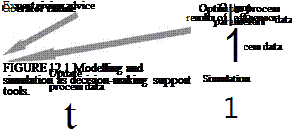
Based on the available and digested information, two approaches are to be followed depending on the issue addressed. The first approach is an open-loop decision making supported with simulation. Nonlinear system modelling combined with multivariable system optimisation is one of the basic principles to be used here. Models are calculated based upon calibration with real-data scenarios. The results are available to the operators and the engineers who will then decide about the next steps to be followed, as shown in Figure 12.1.
![]()
 |
The second approach is closed-loop control. The performance of all quick control functions—currently carried out with simple PID controllers—is to be
evaluated. Then, it can be decided whether there is a potential for improvement with advanced control techniques, such as multivariable process control.
Up to now few on-line simulation applications have been realised in industry. Most of the software tools have been developed in other process industry sectors. The petrochemical industry is the leader in applying simulation on-line. Applications in the paper industry are the multivariate model-based optimisation (multiple – input multiple-output-model predictive control [MIMO-MPC]) of paper machine quality control (basis weight, filler, moisture, and so on) in both machine and cross direction that is currently widely implemented in commercial systems (Metso, ABB, and Honeywell). The optimisation of basis weight, coating weight, and moisture in the cross direction of the sheet were actually one of the first (if not the first) highdimensional MIMO-MPC even though the model of dynamics was rather simple.
These applications serve as a good starting point for optimisation based on advanced simulation. Such ideas have recently been explored in an EU-funded research project (Ritala et al., 2004). The main goal, therefore, is to identify new applications and to use all know-how concerning the dynamic description of papermaking processes to adapt other available solutions to the paper production process.
Some examples described in the references are:
• Wet end stability—Multivariable predictive control to model the interactions in the wet end and in the dry section in order to reduce sheet quality variations by more than 50% and to keep quality on target during long breaks, during production changes, and after broke flow changes. It is achieved by coordinating thick stock, filler, and retention aid flows to maintain a uniform basis weight, ashy content, and white water consistency (Williamson, 2005).
• At an integrated mill in Sweden, multivariate analysis (partial least squares [PLS]) was used to form a model to predict fifteen different paper quality properties. First, 254 sensors were used, but 80% of them turned out to be not reliable due to poor calibration, so only 50 were used. After a further analysis we identified twelve variables as most important, of which five were varied in a systematic way to form good prediction models for the fifteen quality variables. The sensors for the twelve most important variables were calibrated frequently during the experiments. The models were made by measuring online data for a certain volume element of fibres flowing through the plant, and adding off-line quality data for the final product. The model then was used online as a predictor to optimise the production. The problem was that the models started to drift after some weeks and became less good. This is a problem with statistical black box models, at least for many variables (Dahlquist et al., 1999).
• An alternative is then to use a grey box model approach, where the model building starts with a physical model, which is tuned with process data. This type of model was shown to give very reliable values on a ‘ring crush test’ on liner board for several years without any need for recalibration, and was thus used as part of a closed-loop control at several mills (Dahlquist, Wallin, and Dhak, 2004).
• A physical deterministic digester model was made including chemical reactions in a continuous digester as a function of temperature, chemical concentration, and residence time. Circulation loops and extraction lines were included as well. This was used as part of an open-loop MPC and the set points were implemented by the operators manually. The optimised production increased earnings of US$800,000/year in relation to the results if the ‘normal production recipe’ had been used for the same wood quality and production rate (Jansson and Dahlquist, 2004).
• Web-breaks diagnosis was carried out using feed forward artificial neural networks (ANNs) and principal component analysis. Variable selection and further modelling resulted in several improvements: first-pass retention and first-pass ash retention improved by 3% and 4%; sludge generation from the effluent clarifier was reduced by 1%; alum usage decreased; and the total annual cost reduction was estimated around €1 million (Miyanishi and Shimada, 1998).
• At a Spanish paper mill, multiple regression techniques and ANNs are being used to predict paper quality. From an initial set of more than 7500 process parameters, only 50 were preselected for modelling. Statistical analysis has allowed reducing the number of model inputs to less than ten. Predictions for different quality parameters have been very accurate (e. g., R2 for paper formation predictions over 0.74). The next step is to optimise model usefulness and robustness through appropriated validation procedures and reduction of the amount of inputs (Blanco et al., 2005).
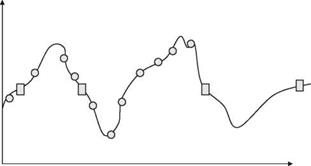
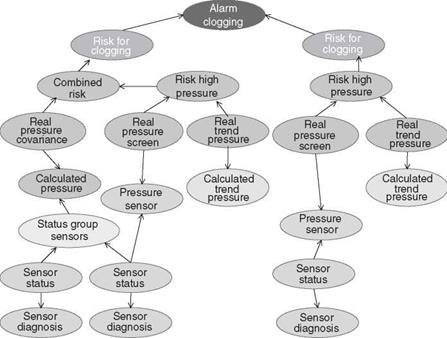
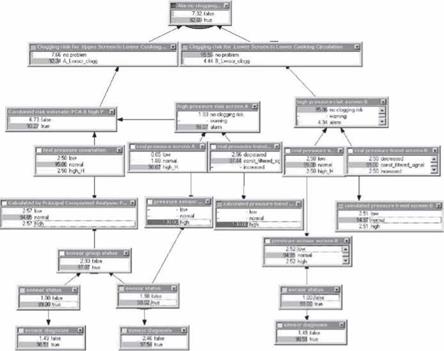
Figure 12.2 shows how sampling frequency may affect the perception of the information. If the frequency of sampling is low, then true changes may not be determined and lead to an incorrect conclusion of the process performance. The information we have gathered can be used in a decision support system as a Bayesian Network. An example of this is shown in Figure 12.3 and the process display of the same data is shown in Figure 12.4.
In dynamic optimisation carried out in parallel with the process, the quality of on-line data and the dynamic validity of the models are of utmost importance.
|
FIGURE 12.2 Sampling frequency and its effects on information. |
|
FIGURE 12.3 An example of a Bayesian Network. |
Quality of data is severely compromised by the slow changes of the characteristic curve relating the signal (in 4 to 20 mA) to the item measured, such as consistency. The common practise for maintaining measurement quality is that occasionally samples of the processed intermediate or final product are taken to a laboratory to be measured. When the on-line measurement deviates considerably from the laboratory value, the characteristic curve is updated for better correspondence. Unfortunately, the updates are made in a rather haphazard manner. Recently, methods to systemise the updating (Latva-Kayra and Ritala, 2005) or for detecting the need for proper determination of the characteristic curve (Latva-Kayra and Ritala, 2005) have been presented.
The validity of the models is monitored similarly to validity of online sensors: comparing laboratory measurements and model predictions. This is because most simulation models can be considered as multi-input soft sensors with rather complex characteristic curves. The dynamic model validation is in its beginning, in particular, for models with considerable nonlinearity.
As available data is extensive, the probability of a data set containing false or missing values is rather high, although the reliability of the sensors was high. For example, if the reliability of sensors were 99%, the probability that a set of 1000 measurements would not contain false values at any given time is only 8%. Therefore
|
FIGURE 12.4 The Bayesian Network of the Danish company Hugin. (With permission.) |
any extensive data analysis or simulation system must be able to detect false values and then be able to provide the users with analysis results and predictions with such incomplete data.

