Regarding a decentralized, deurbanized society, which was central to Scenario B, more barriers remain in the present-day society.
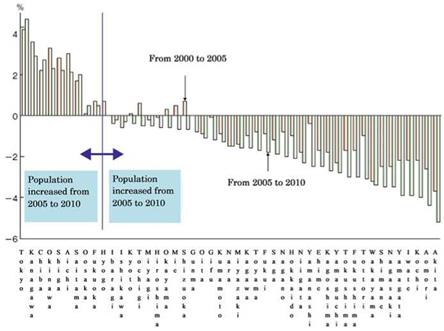
The decline and aging of rural populations has shown no signs of abating since the 1970s. Figure 6.2 shows the change in population from 2005 to 2010 in each prefecture. Tokyo, Kanagawa, Chiba, Okinawa, Shiga, Aichi, Saitama, Osaka, Fukuoka, where mega-cities have developed, are the only prefectures that have experienced population growth over the period. The sharpest decline has been experienced in Akita (5.2 %), Aomori (4.4 %), and Kochi (4.0 %) (Ministry of Agriculture, Forestry and Fisheries 2010).
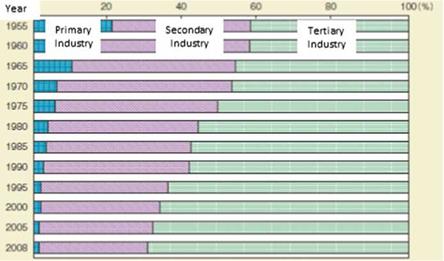
Figure 6.3 shows the change in the number of households operating commercially in the agricultural sector between 1995 and 2010. This figure shows the change in the ratio of industries between 1955 and 2008. It shows that primary industry declined from 20.1 % in 1955 to 1.6 % in 2008 (Ministry of Health, Labor and Welfare 2010) while secondary industry (mining, construction, and manufacturing) increased between 1995 (36.8 %) and 1970 (46.4 %), and tertiary industry (service, sales, etc.) increased from 42.2 % to 69.6 % over the same period (Ministry of Agriculture, Forestry and fishery 2010).
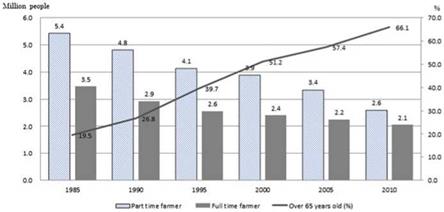
Figure 6.4 shows the change in the number of agricultural households and the agricultural population. The population of this cohort was about 2.6 million, marking a decline of 22 % since 2005 and 33 % since 2000. The reason for this is the retirement of aging farmers, and the change in status of some farmers from being self-employed to being members of their local agricultural co-operative (Ministry of Agriculture, Forestry and Fisheries 2010). It also shows the change in the ratio of farmers more than 65 years of age. The average age of farmers rose from 61.1 years in 2000 to 65.8 years in 2010. The ratio of those over 75 years old in 2010 was about 30 % (Ministry of Agriculture, Forestry and Fisheries 2010).
|
Fig. 6.2 Ratio of population change (from 2000 to 2005, from 2005 to 2010). (From Ministry of Agriculture, Forestry and Fisheries 2010) |
|
Fig. 6.3 Change in ratio of industrial structure. (From Ministry of Health, Labor and Welfare 2010) |
|
Fig. 6.4 Change in number of agricultural households, full-time farmers, part-time farmers (in millions of people), and ratio of farmers over 65 years old (%) from 1985 to 2010. (From Ministry of Agriculture, Forestry and Fisheries 2010) |


