2.3.1 Collected Temperature and Factor Data,
and Mesh Data Results
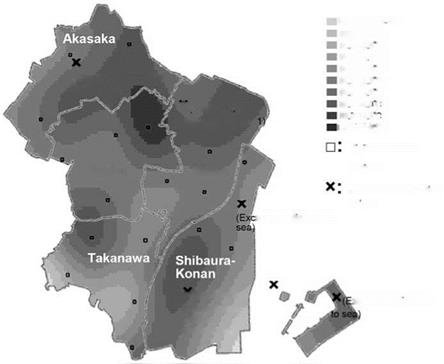
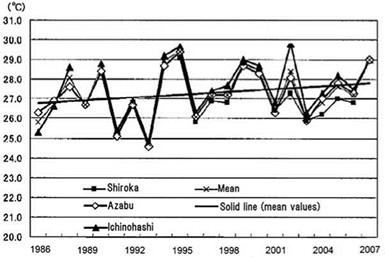
The mean temperatures in Minato-ku in August are shown in Fig. 2.5. Some of the temperature data and factor data used in this study are described as follows. Temperature data were obtained in August 2007 from readings taken by digital weather stations set up at 1.5 m above ground level at 27 sites in Minato-ku, including schools, parks, and other public facilities. The mean daily maximum temperature was calculated for each site, and the values between the observation points were found by surface interpolation (Fig. 2.6).
 From Fig. 2.6 it can be seen that the hottest region of 33 °C or higher occurs primarily around Roppongi in the northern Azabu area, and extends from the
![]()
|
|||
|
|||
|
|||
|
|||
|
|||
|
|||
|
|
||
|
|||
|
|||
|


![]() ”(Excluded: adjacent to JR Tokaido Sbinkansen)
”(Excluded: adjacent to JR Tokaido Sbinkansen)
Fig. 2.6 Temperature distribution on a 50-m mesh
|
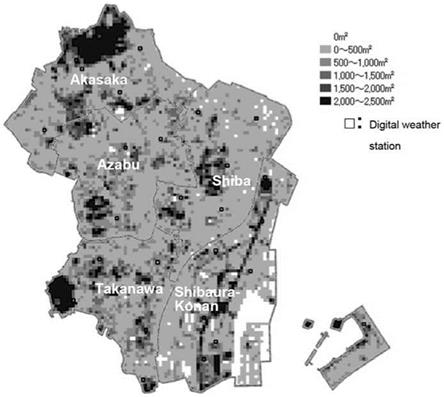
Fig. 2.7 Green space distribution |
northern Shiba area to Akasaka. The next warmest regions are Shirokane in the Takanawa area and Takanawa in the Shibaura-Konan area.
Figure 2.7 shows the distribution of green space in Minato-ku. Those areas with the largest vegetation cover are the Akasaka Imperial Gardens and Aoyama Cemetery to the north, the Institute of Nature Study attached to the National Museum of Nature and Science in the west, and Shiba Park and its environs in the center of Minato-ku. Large parks account for the main green spaces. Other areas lack green space and have less than 500 m2 vegetation per 2,500 m2 (less than 20 % green coverage ratio).
Figure 2.8 shows the distribution of anthropogenic heat emissions in Minato-ku. Emissions are highest in the area reaching from Shimbashi and Roppongi to Hamamatsu-cho, which has a high concentration of commercial buildings, and crowded arterial routes such as metropolitan expressways, national highways, and areas adjacent to those routes.
 |
|
Fig. 2.8 Distribution of anthropogenic heat emissions


