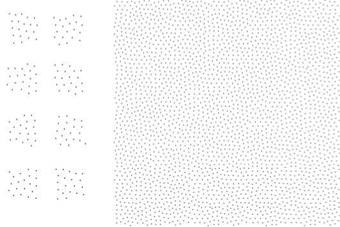
Similar to the point production on a single repeating tile we have to proceed for a set of tiles. The only difference here is that for computing the Voronoi diagram, the points cannot be repeated cyclically over the tile borders. Instead we have to fit them to all possible points that are on tiles that correspond to the actual border colors.
This is implemented in such a way that for the calculation of the movement of a point using the Lloyd’s method, we determine all Voronoi regions that occur if the tile is combined with all tiles with matching border colors. The movement is then determined using the average of all movements indicated by the Voronoi regions. In Fig. 8.12, a set of eight tiles is shown with the resulting point set.
|

This method of generating instances makes sense, as can be seen in Fig. 8.10. As mentioned above, a comparison is shown of a tiling with one tile of 160 sunflowers and a set of eight tiles of 20 plants each. Though the same number of different models is used, the nonperidoc tiling shows no repetition artifacts. The method offers a way to populate an infinitely large plane with a very limited number of objects (eight or more tiles with corresponding plant models) without any visible patterns. If the plant coverage is to be changed locally, new tiles must be added or the corresponding plants have to be inserted manually.


