A classification accuracy assessment generally includes three basic components: sampling design, response design, and estimation and analysis procedures (Stehman and Czaplewski 1998). Selection of a suitable sampling strategy is a critical step (Congalton 1991). The major components of a sampling strategy include sampling unit (pixels or polygons), sampling design, and sample size (Muller et al. 1998). Possible sampling designs include random, stratified random, systematic, double, and cluster sampling. A detailed description of sampling techniques can be found in previous literature such as Stehman and Czaplewski (1998) and Congalton and Green (1999).
The error matrix approach is the one most widely used in accuracy assessment (Foody 2002). In order to properly generate an error matrix, one must consider the following factors: (1) reference data collection, (2) classification scheme, (3) sampling scheme, (4) spatial autocorrelation, and (5) sample size and sample unit (Congalton and Plourde 2002). After generation of an error matrix, other important accuracy assessment elements, such as overall accuracy, user accuracy, producer accuracy (table 6), and kappa coefficient can be derived. Kappa is the difference between the observed accuracy and the chance agreement divided by one minus that chance agreement (Lillesand and Kiefer 1994).
![]()
 LUC classes
Bareground Щ Bulrush
Permanent farmland Щ Coniferus [ Decidious Grassland
Щ Irrigated farmland Щ Non-irrigated farmland Sand dunes Щ Settlement ■ Water bodies
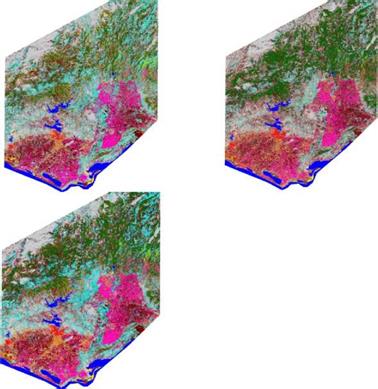
Fig. 7. Data dependent LUC classification results using strong training dataset
|
Error matrix |
Agricultur e |
Forest |
Water |
Total classified pixels |
User accuracy |
|
Agriculture Forest |
32 5 2 39 |
7 34 2 43 |
1 1 36 38 |
40 40 40 120 |
32 / 40 = 80% 34 / 40 = 85% |
|
Water |
36 / 40 = 90% |
||||
|
Total ground truth pixels |
|||||
|
Producer |
32 / 39 |
34 / 43 |
36 / 38 |
||
|
accuracy |
82% |
79% |
95% |
||
|
Overall accuracy |
Correct pixels / Total pixel = 32+34+36 / 120 = 85% |
|
Table 6. Error matrix and accuracy calculations |
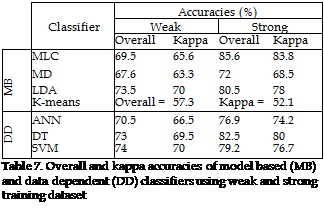
Overall classification accuracies and kappa coefficiencies of each classification using weak (6962 training pixels) and strong (16300 training pixels) training dataset were evaluated (table 7). In addition, each of the LUC user, producer and kappa accuracies were compared using strong training dataset to assess results in detail (table 8). No ancillary data integrated to the classifications, however, it was discussed in section 5.
 |
 Overall classification accuracies indicated that MLC was the most accurate model based classifier when the strong training dataset was used. However, LDA with weak training dataset performed accurately because of its distance separation algorithm. On the other hand, unsupervised k-means classifier was the least accurate one due to the fact that no training pixels were used.
![]() b
b
f
Settlement
Non-irrigated farmland
I__ I Irrigated farmland
I Permanent farmland Water bodies
□
□ Sand dunes Bareground
0 0.5 1 2 f
Fig. 8. Visual detail of a small subview; (a) Ground truth, (b) MLC, (c) MD, (d) LDA, (e) ANN, (f) DT and (g) SVM results
SVM has a reasonable performance than other data dependent classifiers using weak training dataset. However, the largest accuracy was resulted in DT classifier using strong dataset.
SVM classified forestlands, grassland and permanent farmlands more accurate than other classifiers. There was not significant difference in built up areas among classifiers. The most accurate sand dunes, bulrush and irrigated farmland class accuracies were resulted from DT classifier. DT, LDA, SVM showed reasonably well performance with both weak and strong training data sets (figure 8).
In general, data dependent classifiers performed well with weak training dataset. Especially SVM was successful in vegetative area separation. It is clear that if more detailed classification scheme required (e. g. forest tree species) using weak training dataset, SVM might be first option in terms of classification accuracy. On the other hand, application of SVM is time costly when using standard PC and laptops.
Three accuracy calculation methods were shown in table 8, however, major question is which one should be used? Large number of studies have utilized the kappa coefficiencies as an ideal approache for LUC classification.
A number of criteria were selected for the comparison of both model based and data dependent classifiers as (a) Overall accuracy, (b) classification speed, (c) input parameter handling, (d) hardness in application, (e) accuracy with different training sizes and accuracy difference between each class or classification stability (table 9).
|
Criteria |
MLC |
MD |
LDA |
k-means |
ANN |
DT |
SVM |
|
Overall accuracy |
**** |
** |
**** |
* |
*** |
***** |
**** |
|
Classification speed |
***** |
***** |
**** |
**** |
** |
*** |
* |
|
Input parameter handling |
***** |
***** |
***** |
***** |
*** |
*** |
** |
|
Hardness in application |
***** |
***** |
**** |
***** |
*** |
** |
* |
|
Accuracy with different |
**** |
* |
**** |
No |
*** |
***** |
***** |
|
training sizes |
training |
||||||
|
Classification stability |
*** |
*** |
**** |
* |
*** |
***** |
*** |
|
Table 8. Comparing hard classifiers (***** stars and * star refer the most accurate and the poorest performances respectively). |


