The materials on which industry depends are drawn, very largely, from the Earth’s reserves of minerals. A mineral reserve, R, is defined as that part of a known mineral deposit that can be extracted legally and economically at the time it is determined. It is natural to assume that reserves describe the total quantity of minerals present in the ground that is accessible and, once
used, is gone forever, but this is wrong. In reality, reserves are an economic construct, which grow and shrink under varying economic, technical, and legal conditions. Improved extraction technology can enlarge them, but environmental legislation or changing political climate may make them shrink. Demand stimulates prospecting, with the consequence that reserves tend to grow in line with consumption. The world reserves of lead, for instance, are three times larger today than they were in 1970; the annual production has increased by a similar factor.
The resource base (or just resource) of a mineral is the real total, and it is much larger. It includes not only the current reserves but also all usable deposits that might be revealed by future prospecting and that, by various extrapolation techniques, can be estimated. It includes, too, known and unknown deposits that cannot be mined profitably now but which—due to higher prices, better technology, or improved transportation—may become available in the future. Although the resource base is much larger than the reserves, much of it is inaccessible using today’s technology, and its evaluation is subject to great uncertainty.
The distinction between reserves and resources is illustrated by Figure 2.10. It
![]() The distinction between reserves and the resource base. The resource base is fixed. The reserves are the part of this base that has been discovered and established as economically viable for extraction.
The distinction between reserves and the resource base. The resource base is fixed. The reserves are the part of this base that has been discovered and established as economically viable for extraction.
of the ore and, indirectly, of the ease and cost of extracting it. The largest rectangle represents the resource base. The smaller green-shaded rectangle represents the reserves, of which a small part, shaded in gray, has been depleted by past exploitation. The reserves are extended downward by improved mining technology or by an increase in price (because this allows leaner ores to be mined profitably), and they are extended to the right by prospecting. A number of factors cause the reassignment of resources into and out of the reserve classification. They include:
■ Commodity price. As metal prices rise, it becomes profitable to mine lower-grade ore.
■ Improved technology. New extractive methods can increase the economically workable ore grade.
■ Production costs. Rising fuel or labor costs can make deposits uneconomic.
■ Legislation. Tightening or loosening environmental laws can increase or decrease production costs or enable or deprive access to exploitable deposits.
■ Depletion. Mining consumes reserves; prospecting enlarges them.
A rate of production that exceeds that of discovery—the sign that there are problems ahead—causes the reserve to shrink.
Thus the reserves from which materials derive are elastic. It is nonetheless important to have a figure for their current value so that mining companies can assess their assets and governments can ensure availability of materials critical to the economy. There are procedures for estimating the current size of reserves; the U. S. Geological Survey, for example, does so annually. The data sheets in Chapter 12 of this book list the most recent values available at the time of writing.
If you know for a material the size of its reserve and of its annual world production (also listed in the data sheets), it might seem that estimates of resource criticality could be got by dividing the one by the other. That, too, is wrong. The argument follows.
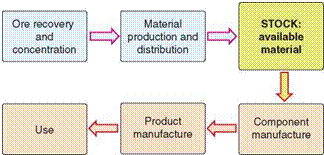
Resource criticality: time to exhaustion. The availability of any commodity depends on the balance between supply and demand. The material supply chain, sketched in Figure 2.11, has a supply side from which material flows into stock. The demand side draws material out, depleting the stock. In a free market, market forces keep the two in long-term balance, though there can be short-term imbalance because increased demand causes the
The supply chain for a material. If the market works efficiently, the supply side and

 |
the demand side remain in balance. Scarcity arises when demand exceeds supply.
supply side to respond by increasing production to compensate. Material scarcity appears when the supply chain fails to respond in this way. Failure can have many origins. The most obvious is that the resource becomes so depleted that it can no longer be exploited economically.
This has led to attempts to predict resource life. If you have D dollars in the bank and you spend it at the rate of S dollars per year without topping it up, you can expect a letter from your bank manager about D/S years from now. The equivalent when speaking of reserves is the exhaustion time, the so-called static index of exhaustion, tex, s:
where R (tonnes) is the reserve and P (tonnes per year) is the production rate. But this ignores the growth. As we have seen, the production rate P is not constant but generally increases with time at a rate r per year. Allowing for this means that the reserves will be consumed in the time:
known as the dynamic index.
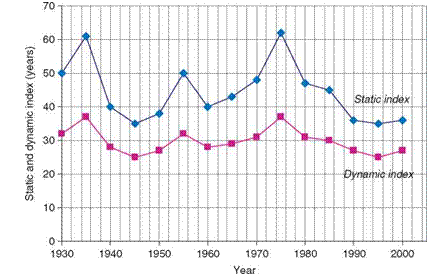
Figure 2.12 shows the static and dynamic index for copper over the last 70 years. The static index has hovered around 40 years for the whole of that time; the dynamic index has done the same at 30. As a prediction of resource exhaustion, neither one inspires confidence. Do either of these
 |
make sense? The message they convey is not that we will soon run out of copper; it is that a comfort zone for the value of the index exists and that it is around 30 years. Only when it falls below this value is there sufficient incentive to prospect for more. We need to approach the problem of resource criticality in another way.
Market balance and breakdown. Thus far we have assumed (without saying so) that the market works efficiently, keeping the supply side and the demand side in balance. When it does, increased demand is met by increased prospecting and improved technology. The price of material then reflects the true cost of its extraction. But what happens when market forces don’t work? That is a thought that troubles both businesses and government.
Some resources are widely distributed, but others are not. For these the ore bodies that are rich enough to be worked economically are located in just a few countries; this is called supply chain concentration. Then political unrest, economic upheaval, rebellion, or forced change of government in one of these or its neighbors (through which the ore must be transported) disrupts supply in ways to which the market cannot immediately respond. And there is the potential, too, for the few supplier nations to reach agreement to limit supply, thereby driving up prices, a process known as cartel action. The market cannot immediately respond, because it takes time to set up new extraction facilities and establish new supply chains.
If the supplier that stocks your favorite wine closes, you seek another supplier. If that supplier, already under pressure, has only limited stock, you could try to buy it all and store it, creating a stockpile. If the supplier refuses, you have to consider reducing your consumption or—horrors—finding a substitute, keeping your favorite wine for special occasions. That, too, is the reaction of the demand side of the market: seek other suppliers, stockpile, explore substitutes for all but the most demanding applications, and (something that does not work with wine) increase recycling.
Can scarcity be predicted? That caused by failure of the supply chain becomes less likely when the chain is diverse, meaning that the ore deposits are widely distributed and there are many producers and distributors. For some materials the reverse is true; then attempts to control price by limiting supply become more likely. Scarcity caused by depletion can be countered by developing extraction technologies to deal with leaner ores and by increased recycling.
With this background, let us return to the question of criticality.
 |
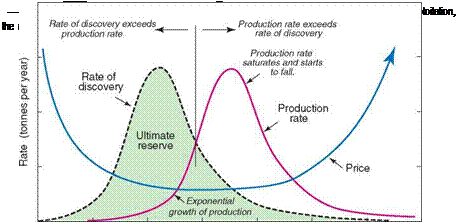
More realistic indicators of criticality. The argument here gets a little more complex. Figure 2.13 helps set it out. The resource base—the big rectangle of Figure 2.10—is, of course, finite. The broken curve of Figure 2.13 shows schematically how the reserves—the exploitable part of the resource base— at first grows as prospecting and improved extraction technology reveal more. Its exploitation (the red curve) begins to eat it away, but initially the
![]()
rate of discovery reassuringly exceeds that of exploitation and no alarm bells ring. But there comes a point at which the finding of new deposits and further improved technology become more difficult and the reserves, though still growing, grow at a rate that falls behind that of production. This decline in discovery rate is followed, with a characteristic time lag, by a decline in production.
This progression is reflected in the price of minerals. When first discovered and exploited, a mineral is expensive (blue line in Figure 2.13). As extractive technology improves and prospecting unveils richer deposits, the price falls. Though reserves remain large, the price, when corrected for inflation, settles to a plateau. But then, with about the same time lag as that for fall in production, depletion makes itself felt and the price climbs. The crossing point is significant: once past this point, the reserves start to shrink—they are being used faster than they are being topped up. There are indicators of criticality here that can be taken seriously:
■ The rate of growth of discovery falls below the rate of growth of production.
■ The production rate curve peaks and starts to decline.
■ The minimum economic ore grade falls.
■ The price starts to rise sustainable.
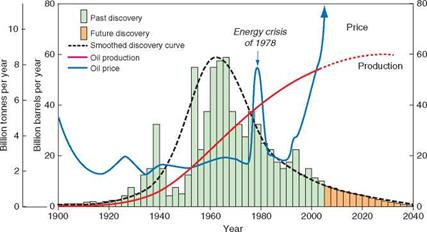
In reality, the curves are not smooth. Figure 2.13 is a schematic; Figure 2.14 is real. It shows oil discoveries, production, and price corrected to the value of the dollar in 2000 over time since 1900.
|
|
Here some of the fluctuations are included. Major discoveries do not occur every year, giving the lumpy profile of the green blocks. Anticipated discovery between now and 2040 are the orange blocks. Another big lump or two is not impossible—the competing claims by Russia, Norway, Canada, and the United States for territorial rights in the Arctic suggest that there may be large deposits there. Ignoring this for the moment, a smooth curve (the black broken line) has been sketched in. Growth in production (the red one) is much smoother; the demand has grown steadily over the past 100 years. There have been some fluctuations (not shown), but these are small. That of price (the blue curve on the scale at right) is much more erratic. Oil price does not reflect the actual cost of extraction but the degree to which production is controlled to maintain price. As reserves are depleted, those of the greatest consumers—the United States and Western Europe—become exhausted, creating dependence on imports and vulnerability to production quotas; the spike in the 1970s and that of today are examples. The fluctuations of the real data are distracting, but if these are smoothed out, say, using a 10-year moving average of the data, the evolution is that of the schematic. We are past the crossover point of the discovery and production-rate curves. It seems likely that at least part of the recent rise in price is not a temporary fluctuation but is here to stay. Price increases as large as this, however, open new doors. Oil sands and offshore Arctic oil, for example, have until now been largely inaccessible because of the cost of exploitation. They now become economically attractive, extending the tail of the estimated production curve in Figure 2.14.
The crossover points of the discovery and production curves for most minerals from which engineering materials are drawn have not yet been reached. For many it is still far off. But at least we now have measures that mean something.


