Emerging legislation imposes ever-increasing demands on manufacturers for eco-accountability. The EU Directive 2005/32/EC on Energy Using Products (EuPs), for example, requires that manufacturers of EuPs must demonstrate "that they have considered the use of energy in their products as it relates to materials, manufacture, packaging, transport, use and end of life." This sounds horribly like a requirement that a full LCA be conducted on each one of a manufacturer’s products; because many manufacturers have thousands of products, the expense in terms of both money and time would be prohibitive.
The complexity of an LCA makes it, for many purposes, unworkable. This perception has stimulated two lines of development: simplified, or "streamlined," methods of assessment that focus on the most significant inputs, neglecting those perceived to be secondary; and software-based tools that ease the task of conducting an LCA. Software solutions are documented in the appendix to this chapter. We turn now to streamlining.
&
|
<y |
|
An example of a streamlined LCA matrix. |
FIGURE 3.6
The matrix method. The detail required for a full LCA excludes its use as a design tool; by the time the necessary detail is known, the design is too far advanced to allow radical change. Streamlined LCA attempts to overcome this problem by basing the study on a reduced and simplified inventory of resources, accepting a degree of approximation while retaining enough precision to guide decision making. One approach is to simplify while still attempting a quantitative analysis—one using numbers. This method is developed in later chapters of this book and illustrated with case studies. The other—one developed by Graedel[5] and others and used in various forms by a number of industries—is qualitative. The matrix of Figure 3.6 shows the idea. The life phases appear as the column headers, the impacts as the row headers. An integer between 0 (highest impact) and 4 (least impact) is assigned to each matrix element Mj, based on experience guided by checklists, surveys, or protocols.[6] The overall Environmentally Responsible Product Rating, Rerp, is the sum of the matrix elements:
Rerp = EE Mjj (3.1)
i І
Alternative designs are ranked by this rating.

There are many variants of this approach, differing in the impact categories of the rows and the life (or other) categories of the columns. The method has the merit that it is flexible, is easily adapted to a variety of products, carries a low overhead in time and effort, and, in the hands of practitioners of great experience, can take into account the subtleties of emissions and their impacts. It has the drawback that it relies heavily on judgment. It is not a tool to put in the hands of a novice. Is there an alternative?
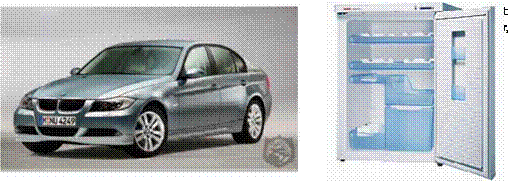
One resource, one emission. There is, as yet, no consensus on a metric for eco-impact of product life that is both workable and able to guide design. On one point, however, there is a degree of international agree – ment:[7] a commitment to a progressive reduction in carbon emissions, generally interpreted as meaning CO2. At the national level the focus is more on reducing energy consumption, but since this and CO2 production are closely related, reducing one generally reduces the other. Thus there is a certain logic in basing design decisions on energy consumption or CO2 generation. They carry more conviction than the use of a more obscure indicator, as evidenced by the now-standard reporting of both energy efficiency and the CO2 emissions of cars and the energy rating and ranking of appliances (Figure 3.7) dealing with the use phase of life. To justify this further, we digress briefly to glance at the IPCC report of 2007.
The 2007 IPCC report. The Intergovernmental Panel on Climate Change (IPCC), an international study group set up by the World Meteorological Organization and the United Nations Environmental Panel, has published a
250
![]()
![]()
![]()
![]()
![]()
 10,000 5,000 0
Time (years before 2005)
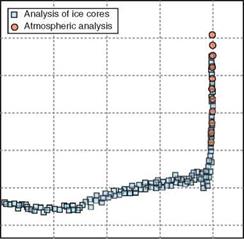
![]() Atmospheric concentration of CO2 over the last 10,000 years measured from ice cores and atmospheric samples. Redrawn from the IPCC report of2007.
Atmospheric concentration of CO2 over the last 10,000 years measured from ice cores and atmospheric samples. Redrawn from the IPCC report of2007.
series of reports on the effect of industrial activity on the biosphere and the human environment. The most recent of these (IPCC, 2007) is of such significance that familiarity with it is a prerequisite for thinking about sustainability and the environment. Briefly, the conclusions it reaches are these:
■ The average air, ocean, and land-surface temperatures of the planet are rising. The increase is causing widespread melting of snow and ice cover, rising sea levels, and changes of climate.
■ Climate change, measured, for instance, by the average of these temperatures, affects natural ecosystems, agriculture, animal husbandry, and human environments. As little as 1°C rise in average global temperature can have a significant effect on all of them. A rise of 5° would be catastrophic.
■ The global atmospheric concentration[8] of CO2 has increased at an accelerating rate since the start of the industrial revolution (around 1750) and is now at its highest level for the past 600,000 years. Most of the increase has occurred between 1950 and the present day (see Figure 3.8).
■ Increasingly accurate geophysical measurement allow the history of temperature and atmospheric carbon to be tracked, and increasingly precise meteorological models allow scenario exploration and prediction of future trends in both. The two together establish beyond all reasonable doubt that the climate-temperature rise is caused by greenhouse gases, and that, though there are causes, it is manmade CO2 that is principally responsible. The potential consequences of further rise in climate temperature, details in the IPCC report, give cause for concern, to which we return in Chapters 10 and 11.
The point, then, is that, of the many emissions associated with industrial activity, it is CO2 that is of greatest current concern. It is global in its impact, causing harm both to the nations that generate most of it and those that do not. It is closely related to the consumption of fossil fuels, themselves a diminishing resource. And if the IPCC report is to be taken seriously, the urgency to cut carbon emissions is great. At this stage in structuring our thinking about materials and the environment, taking energy consumption and the release of atmospheric CO2 as metrics is a logical simplification.


