Table 6.1 lists ecodata for materials in a similar format to the data sheets of Chapter 12. Here we step through the blocks, explaining what the names mean. The data themselves are drawn from many sources. They are listed under Further Reading at the end of this chapter.
Geo-economic data. The first block of data in Table 6.1 contains information about the resource base from which the material is drawn and the rate at which it is being exploited. The annual world production is simply the mass of the material extracted annually from ores or feedstock, expressed in terms of the tonnes of metal (or other engineering material) it yields. The reserve, as explained in Chapter 2, is the currently reported sizes of the economically-recoverable ores or feedstock from which the material is extracted or created.
Ecoproperties: material production. The embodied energy Hm is the energy that must be committed to create 1 kg of usable material—1 kg of steel stock, or of PET pellets, or of cement powder, for example—measured in MJ/kg.
|
Table 6.1 Eco-attributes of a material |
|
|
Aluminum alloys |
|
|
Geo-economic data for principal component Annual world production |
33 x 106-34 x 106 tonnes/yr |
|
Reserve |
20 x 109-2.2 x 10⁹ tonnes |
|
Ecoproperties: material production |
|
|
Embodied energy, primary production |
200-240 MJ/kg |
|
CO2 footprint, primary production |
11-13 kg/kg |
|
Water usage |
125-375 l/kg |
|
Eco-indicator |
740-820 millipoints/kg |
|
Ecoproperties: processing |
|
|
Casting energy |
2.4-2.9 MJ/kg |
|
Casting CO2 footprint |
0.14-0.17 kg/kg |
|
Deformation processing energy |
2.4-2.9 MJ/kg |
|
Deformation processing CO2 footprint |
0.19-0.23 kg/kg |
|
Recycling |
|
|
Embodied energy, recycling |
18-21MJ/kg |
|
CO2 footprint, recycling |
1.1-1.2 kg/kg |
|
Recycle fraction in current supply |
33-55% |
The CO2 footprint is the associated release of CO2 into the atmosphere, in kg/kg.1 It is tempting to try to estimate embodied energy via the thermodynamics of the processes involved; extracting aluminum from its oxide, for instance, requires the provision of the free energy of oxidation to liberate it. This much energy must be provided, it is true, but it is only the beginning. The thermodyamic efficiencies of processes are low, seldom reaching 50%. Only part of the output is usable; the scrap fraction ranges from a few percent to more than 10%. The feedstocks used in the extraction or production themselves carry embodied energy. Transport is involved. The production plant itself has to be lit, heated, and serviced. And if it is a dedicated plant, one that is built for the sole purpose of making the material or product, there is an "energy mortgage"—the energy consumed in building the plant in the first place.
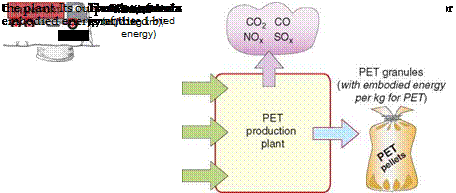
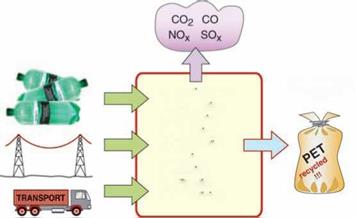
Embodied energies are more properly assessed by input/output analysis. For a material such as ingot iron, cement powder, or PET granules, the embodied energy/kg is found by monitoring over a fixed period of time the total energy input to the production plant (including that smuggled in, so to speak, as embodied energy of feedstock) and dividing this total by the quantity of usable material shipped out of the plant. Figure 6.1 shows, much simplified, the inputs to a PET production facility: oil derivatives such as naptha and other feedstock, direct power (which, if electric, is generated in part from fossil fuels with a production efficiency of about 35%), and the energy of transporting the materials to the facility.
The material inputs to any processing operation are referred to as feedstock. Some are inorganic, some organic. Accounting for inorganic feedstock is straightforward because, during processing, they appear either in the final product or in the waste output. Accounting for organic feedstock is more complex because they can be used either as a material input or as a fuel input. When used as a fuel, the material is burned to provide energy and, once burned, is gone forever. In the case of fossil fuels—oil and gas— their use as fuels represents a depletion of the resource. By contrast, when organics are used as materials (oil as a feedstock for plastics, for example), its energy content is not lost but is rolled up and incorporated into the product. Using it in this way also represents a depletion of the resource, although it does not give rise to any air emissions.
In describing the embodied energy of materials or products it is important to include feedstock energies in the total because they represent a [23]
 |
material.
demand for a resource to support the system of production. The plant of Figure 6.1 has an hourly output of usable PET granules. The embodied energy of the PET, (Hm)PET, with usual units of MJ/kg, is then given by
^ Energies entering plant per hour m PET Mass of PET granules produced per hour
The CO2 footprint of a material is assessed in a similar way. The carbon emissions consequent on the creation of unit mass of material include those associated with transport, the generation of the electic power used by the plant, and that of feedstocks and hydrocarbon fuels. The CO2 footprint, with the usual units of kg of CO2/kg, is then the sum of all the contributions per unit mass of usable material exiting the plant.
Plants grow by absorbing CO2 from the atmosphere and H2O from the Earth to build hydrocarbons, notably cellulose and lignin, the building blocks of wood. Wood thus sequesters carbon. This has led to the statement that the carbon footprint of wood is negative; wood absorbs carbon rather than releasing it.
Many ecostatements need close scrutiny and this is one. Coal is a hydrocarbon, derived, like wood, from plant life. The carbon in coal was once in the atmosphere; the formation of coal sequestered it. But we do not credit coal with a negative carbon footprint because, when we use it, we do not replace it; the carbon it contains is returned to the atmosphere. A credit is only real if the resource is replaced.
Some plant life, useful in engineering, can be grown "sustainably." Hemp, used in rope and fabrics, building construction, and, increasingly, to reinforce polymer composites, is one. Hemp can be grown without fertilizers, and it grows fast; it can be grown as fast as it is used. The carbon it sequesters is retained in the fabric, building, or composite made from it, so its use generally removes carbon from the atmosphere, returning it when it is burned or decomposes at end of life. A carbon-neutral cycle is possible here.
So the question: is wood like coal or is it like hemp? At an international level, the world’s forests are being cut down for construction, fuel, pulping, and mere clearing at a far greater rate than they are replanted. Trees take 80 years to grow to maturity; planting trees to offset the carbon footprint of driving a car (average life: 14 years) does not add up. Until stocks are replaced as fast as they are used, wood has to be viewed as a resource that is more like coal than hemp, with a corresponding positive carbon footprint. The data sheets for wood and wood-based materials in Chapter 12 take this approach.
Wood-based products—plywood, chipboard, fiberboard and the like— have the merit that they use more of the trunk than solid wood beams or panelling do, and they can be made from lower-grade timber. But all involve a significant component of a polymer adhesive, driving the energy content and carbon footprint yet higher.
Data precision. Figure 6.2 plots some of the reported values of embodied energy for aluminum over time, starting with the earliest measurements, around 1970. The mean value of the data plotted here is 204 MJ/kg. But the standard deviation is 58 MJ/kg, and that is 25% of the mean. A closer examination of the data sources shows some to be more rigorous than others, so a more selective plot shifts the mean to 220 MJ/kg and reduces the standard deviation to, perhaps, 10%. Hammond and Jones (2006) plot embodied energies for a number of materials in this way. They all have the same feature: a standard deviation of between 10% and 50% of the mean. It is worth remembering that engineers don’t design on a mean property value but on an "allowable" that is somewhere between 1 and 6 standard deviations on the safe side of the mean. So, the bottom line—when dealing with embodied energies such as the 220 MJ/kg quoted previously, read them thus: the first figure can be trusted; the second is debatable; the third is meaningless.
Water usage. The data sheets list the approximate quantity of commercial water, in liters, used in the production of 1 kg of material.
Eco-indicators. As explained in Chapter 3, attempts have been made to roll up the energy, water, and gaseous, liquid, and solid emissions associated
![]()
 |
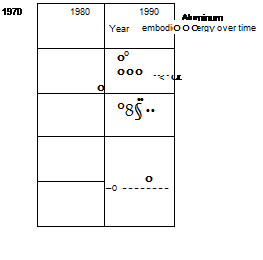 |
Data for the embodied energy of aluminum. The mean is 204MJ/kg, with a standard deviation of 58 MJ/kg. Using the best-characterized data only gives a mean of220MJ/kg with a standard deviation of 20 MJ/kg.
with material production into a single number, or eco-indicator. The records in Chapter 12 include the value when it is available.
Ecoproperties: processing energy and CO2 footprint. Product manufacture requires that materials be shaped, joined, and finished. The processing energy Hp associated with a material is the energy, in MJ/kg, used to do this. Thus polymers, typically, are molded or extruded; metals are cast, forged, or machined; ceramics are shaped by powder methods, composites by molding or lay-up methods (see Table 6.2). A characteristic energy per kg is associated with each of these. The energy consumed by a casting furnace or an injection-molding machine can be directly measured, but the production plant as a whole uses more than this through the provision of transport, heating, lighting, management, and maintenance.
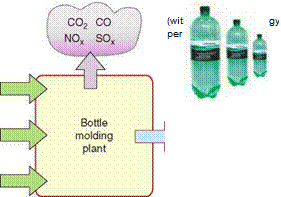
A more realistic measure of processing energy is the total energy entering the plant (but excluding that embodied in the materials that are being shaped since that is attributed to the material production phase) divided by the weight of usable shaped parts that it delivers, giving a value in MJ/kg. Continuing with the PET example, the granules now become the input (after transportation) to a facility for blow-molding PET bottles for water, as shown in Figure 6.3. As before, energy and feedstock are consumed, emissions and waste are excreted, and the products—PET blow-molded bottles—emerge.
Shaping methods
![]() Shaping of metals
Shaping of metals
Casting
Forging, rolling (deformation processing)
Metal powder processing Vapor-phase methods
Shaping of polymers
Polymer molding (thermo-forming, injection molding, etc.) Polymer extrusion Polymer machining
Shaping of ceramics
Ceramic powder forming
Shaping of glasses
Glass molding
Shaping of composites
 |
 |
Simple composite molding Advanced composite molding
Manufacture: here, the blow-molding of PET bottles.
The output of the analysis is the energy-committed per unit weight of bottles produced. The CO2 footprint is evaluated in a similar way.
The availability and precision of data for processing are particularly poor due to differences in processing equipment and manufacturing practice. Reports of the total annual energy consumed by the metal-casting and
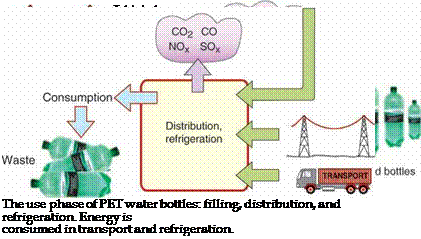 |
FIGURE 6.4
polymer-molding industries in the United States are available; these also list the annual tonnage of usable castings and moldings they produce. Information of this sort allows estimates of processing energies for a number of primary shaping processes. It is these that appear in the records of Chapter 12.
Processing energies are generally smaller than the energy embodied in the material or that consumed during its use. This being so, the lack of precision here is less critical than if the reverse were true.
Recycling and end-of-life. The product is now transported to the point of sale, passes to the consumer, is used, and, ultimately, reaches the end of its useful life (see Figure 6.4).
Underlying data for transport and use are explored in Section 6.4. Here we jump to the last block of attributes listed in Table 6.1: those relating to recycling. The existence of embodied energy has another consequence: that the energy to recycle a material is sometimes much less than that required
2. ![]()
Chopping
3. Washing
4. Separation
5. Drying
6. Melting
7. Filtration
8. Pelletizing
Recycling. Many steps are involved, all of which consume some energy, but the
|
embodied energy of the material is conserved.
|
for its first production because the embodied energy is retained (see Figure 6.5). The recycling energy, listed in the data sheets, is, despite its approximate nature, a useful indicator of the viability of recycling. Typical values lie in the range of 10-100 MJ/kg.
 Special cases: precious metals and electronics. Precious metals are used in small quantities, but they carry a heavy burden of embodied energy, carbon, and, of course, cost. But they have unique properties: exceptional electrical conductivity, exceptional resistance to corrosion, and exceptional properties as electrodes, sensors, and catalysts. A rule of convenience in energy accounting, used later, is to ignore (or approximate) the contribution of parts that contribute less than 5% of the weight of the product, but we can’t do that with precious metals; even a small quantity adds significantly to the energy and carbon totals. Table 6.3 lists the data needed to include them.
|
Table 6.4 Approximate embodied energies and CO2 footprints for electronic components |
||
|
Component |
Embodied energy (MJ) |
Carbon footprint (kg) |
|
Small (handheld) electronic devices, depending on scale (per kg) |
2000-4000 |
200-400 |
|
Displays, depending on size (per m2) |
2950-3750 |
295-375 |
|
Assembling of printed wiring boards (per kg) |
120-140 |
12-14 |
|
Batteries (Ni-Cd rechargeable) (per kg) |
180-220 |
18-22 |
The same is true of electronic components: integrated circuits, surface – mount devices, displays, batteries, and the like. They are now an integral part of almost all appliances. They don’t weigh much, but they are energyintensive to make. Table 6.4 lists sufficient data to include them at an approximate level.


