The need, as we’ve already said, is for an assessment strategy that addresses current concerns and combines acceptable cost burden with sufficient precision to guide decision making. The strategy should be flexible enough to accommodate future refinement and simple enough to allow rapid "What if?" exploration of alternatives. To achieve this goal, it is necessary to strip off much of the detail, multiple targeting, and complexity of method that makes standard LCA techniques so cumbersome. The approach developed here has three components.
Adopt simple metrics of environmental stress. The preceding discussion points to the use of energy or of a CO2 footprint as the logical choices. The two are related and are understood by the public at large. Energy has the merit that it is the easiest to monitor, can be measured with relative precision, and, with appropriate precautions, can, when needed, be used as a proxy for CO2.
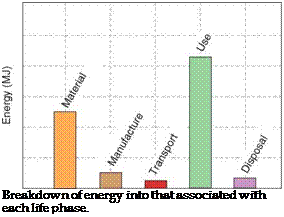
Distinguish the phases of life. Figure 3.9 suggests the breakdown, assigning a fraction of the total life-energy demands of a product to material creation, product manufacture, transport, and product use and disposal. Product disposal can take many different forms, some carrying an energy
 |
FIGURE 3.9
penalty, some allowing energy recycling or recovery. Because of this ambiguity, disposal has a chapter (Chapter 4) to itself.
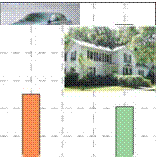
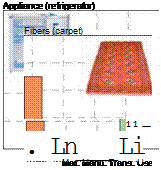
When this distinction is made, it is frequently found that one of the phases of Figure 3.1 dominates the picture. Figure 3.10 presents the evidence. The upper row shows an approximate energy breakdown for three classes of energy-using products: a civil aircraft, a family car, and an appliance. For all three the use phase consumes more energy than the sum of all the other phases. The lower row shows products that still require energy during the use phase of life, but not as intensively as those of the upper row. For these, the embodied energies of the materials of which they are made make the largest contribution.
Two conclusions can be drawn. The first: one phase frequently dominates, accounting for 60% or more of the energy—often much more. If large energy savings are to be achieved, it is the dominant phase that becomes the first target, since it is here that a given fractional reduction makes the biggest contribution. The second: when differences are as great as those of Figure 3.10, great precision is not necessary; modest changes to the input data leave the ranking unchanged. It is the nature of people who measure things to want to do so with precision, and precision must be the ultimate goal. But it is possible to move forward without it; precise judgments can be drawn from imprecise data. Chapter 7 explains how the breakdowns are made and gives examples.
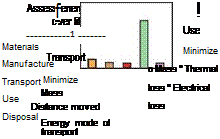
Base the subsequent action on the energy or carbon breakdown. Figure 3.11 suggests how the strategy can be implemented. If material production is the dominant phase, the logical way forward is to choose materials
![]()
 |
 |
 |
 |
|||
Approximate values for the energy consumed at each phase of Figure 3.1 for a range of products (data from References 5 and 6). The disposal phase is not shown because there are many alternatives for each product.
with low embodied energy and to minimize the amounts that are used. If manufacture is an important energy-using phase of life, reducing processing energies becomes the prime target. If transport makes a large contribution, seeking a more efficient transport mode or reducing distance becomes the first priority. When the use phase dominates, the strategy is to minimize mass (if the product is part of a system that moves), to increase thermal efficiency (if a thermal or thermomechanical system), or to reduce electrical losses (if an electromechanical system). In general the best material choice to minimize one phase will not be the one that minimizes the others, requiring trade-off methods to guide the choice.
Implementation requires tools. Two sets are needed: one to perform the eco-audit sketched in the upper part of Figure 3.11, the other to enable the analysis and selection of the lower part. The first, the eco-audit tool, is described in Chapter 7. The second, that of optimized selection, is the subject of Chapters 8 and 9. Tools require data. Chapter 12 of this book contains
 |
 |
 |
 |
Summary and conclusion 55
data sheets for materials, documenting their engineering and ecoproper – ties.[9] The engineering properties are familiar. The ecoproperties are less so; Chapter 6 explores them.


