G. Abumeri1, F. Abdi1, K. S. Raju2, J. Housner1, R. Bohner3 and A. McCloskey3 1Alpha STAR Corp., Long Beach, CA 2National Institute for Aviation Research, Wichita State University, KS 3Northrop Grumman Corporation, El Segundo CA
USA
1. Introduction
The objective of this work is to provide the aerospace community with a robust computational capability to determine composite material strength allowables. The technical approach presented in this document serves two purposes: (1) reduce laminate level testing for determination of allowables; and (2) estimate allowables with some level of reliability when such data are difficult to obtain. A – and B-basis strength values are essential for reducing risk in aircraft structural components made from fiber reinforced polymer composite materials. Risk reduction is achieved by lowering the probability of failure of critical aircraft structures through the use of A – and B-basis design values. Generating strength allowables solely by means of testing is costly and time consuming as large number of composite coupons must be tested under various environments: cold, ambient and elevated temperatures (with and without moisture). The aerospace community is challenged by the following: (1) tests must be conducted on many types of coupons to determine allowables for in-plane and out-of-plane properties (un-notched and notched); and (2) new composite materials are introduced to the market at a rapid rate amplifying the need for timely cost effective approach. The tests must be carried out in accordance to standards set by ASTM (American Society for Testing and Materials).
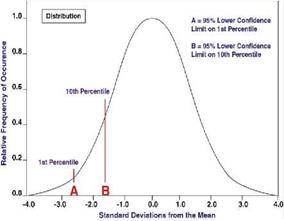
Current practices for determining allowables follow procedures recommended by FAA and working draft of the composite materials handbook CMH-17 Rev G (formerly military handbook Mil-HDBK-17-1F) [1&2]. Table 1 lists the robust and reduced test sampling requirements set forth by CMH-17. Determination of A-basis values requires more test samples than those needed to determine B-basis values as A-basis strength are applied to single members within an assembly whose failure would result in loss of structural integrity. For A-basis, at least 99% of the population of material strength values is expected to equal or exceed this tolerance bound with 95% confidence. B-basis values are applied to redundant structures where failure would result in safe load redistribution. For B-basis, 90% of the population of material strength values is expected to equal or exceed that strength value with 95% confidence. Figure 1 illustrates the statistical definition of 0.01 and 0.10 probabilistic
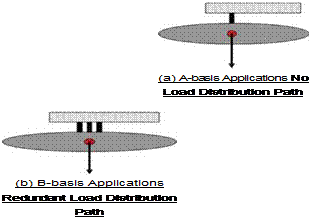
strength for A-basis and B-basis, respectively. The physical definition of A – and B-basis is presented in Figure 2. A-basis strength value [2] is traditionally calculated using equation (x – (KA) ‘S ); similarly B-basis strength value is computed using equation (x -(KB)S ); where x is the mean strength of the test samples, S is sample standard deviation, and KA and KB are tolerance factors. The higher the tolerance factor, the lower the allowable; the higher the number of test replicates the more stable the allowable. CMH-17 provides tables of tolerance factors for various distributions as function of the sample size. The same procedures and standards require checking for outliers, distribution types if non-normality is observed, and batch variability. Details on numerical and test procedures for standard practice for determination of allowables can be found in [1 & 2].
|
Category |
# of Batches |
# of Samples |
Category |
# of Batches |
# of Samples |
|
A-basis – Robust Sampling |
10 |
75 |
B-basis – Robust Sampling |
10 |
55 |
|
A-basis – Reduced Sampling |
5 |
55 |
B-basis – Reduced Sampling |
3 |
18 |
|
Table 1. FAA Guidelines for Robust and Reduced Sampling The proposed approach for determination of strength allowables builds on existing accepted standards and practices [1&2]. It uses statistics from lamina level testing to reverse engineer uncertainties in fiber and matrix material properties and manufacturing variables. These uncertainties are subsequently used in generating virtual test samples for laminated notched and un-notched specimens. The virtual samples are then used in lieu of actual test samples with resulting savings in cost and time. The methodology combines probabilistic methods with advanced multi-scale multi-physics progressive failure analysis (MS-PFA) [4] to reduce the number of tests needed for determination of A – and B-basis strength values. Details of the technical approach are provided next and the viability of the approach is demonstrated through application to four composite materials. |
|
|
 |
Fig. 2. Physical Definition of A-and B-Basis Strength
2. Nomenclature
 Lamina extensional modulus in fiber direction
Lamina extensional modulus perpendicular to fiber direction
Fiber extensional modulus in fiber direction
Fiber extensional modulus perpendicular to fiber direction
Matrix extensional modulus
Lamina compressive strain limit parallel to fiber
Lamina tensile strain limit parallel to fiber
Lamina in-plane strain limit
Lamina compressive strain limit perpendicular to fiber
Lamina tensile strain limit perpendicular to fiber
Fiber volume ratio
Void volume ratio
Matrix volume ratio
Lamina in-plane shear modulus
Fiber shear modulus – In-plane
Fiber shear modulus – Out-of-plane
Graphical user interface
In-plane shear
Longitudinal compression
Longitudinal tension
Lamina compressive strength in fiber direction Lamina tensile strength in fiber direction Lamina in-plane shear strength
Lamina compressive strength perpendicular to fiber direction
Lamina tensile strength perpendicular to fiber direction
Fiber compressive strength
Fiber tensile strength
Matrix compressive strength
Matrix shear strength
|
SmT |
Matrix tensile strength |
|
TT |
Transverse tension |
|
TC |
Transverse compression |
|
CDF |
Cumulative distribution function |
|
|
Probability density function |
|
COV |
Coefficient of variation |


