This research started with analyzing LULC change during the study period. Supervised classification, the most widely used technique for quantitative analysis of remote sensing image data (P6cas et al. 2011), was used to perform image classification. To evaluate the accuracy of the classified images, an accuracy assessment
|
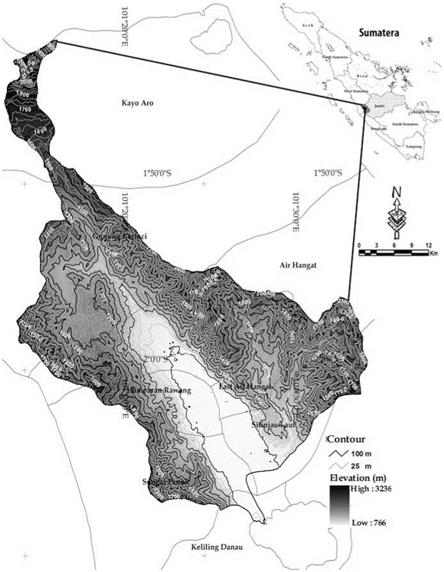
Fig. 14.1 Batang Merao watershed showing the elevation at 25-m and 100-m contour intervals |
or confusion contingency matrix was implemented. The error matrix compared the linkages between known reference data (ground truth) and the corresponding results of an automated classification (Congalton 1991). The kappa coefficient, the value for estimating how accurate the remotely sensed classification is in the reference data (Jensen 2004), was used for accuracy assessment. The kappa (Khat) is computed as follows:
|
Data |
Description |
Source |
|
Landsat TM |
Path 126/row 61 July 13, 1990 May 5, 2000 June 18, 2010 |
http://glovis. usgs. gov/ |
|
DEM |
Aster GDEM 30 m |
http://demex. cr. usgs. gov/ |
|
Administrative |
Jambi Province |
Geospatial Information |
|
Kerinci regency |
Agency of Indonesia (BIG) |
|
|
Watershed boundary |
Planning Agency of Jambi |
|
|
Soil series map |
Soil type 1990, 2000, 2010 |
Planning Agency of Kerinci |
|
Rainfall |
Monthly rainfall and distribution 1990-2010 |
Forestry office of Batanghari (BPDAS) |
|
Land use planning map |
Regional land use planning |
|
|
Ground truth |
Ground truth 2011 |
Field survey |
|
Table 14.1 Data collection and its description |
where r is the number of rows in the error matrix, xt is the number of observations in row i and column i, xi+ and x+i are the marginal totals for the row i and column i, respectively, and N is the total number of pixels. Value greater than 0.80 represent strong agreement or good classification performance, values between 0.40 and 0.80 indicated moderate agreement, and values less than 0.40 represent poor agreement (Jensen 2004).
LULC classification was modified from the LULC categories of the Indonesian National Standard No. 7645:2010 specified by the National Standard Agency of Indonesia, which refers to the FAO’s land cover classification system and ISO 19144-1 (BSN-National Standardization Agency of Indonesia 2010). Because of differences in scale, accuracy, and type of LULC categories, synchronization and generalization were performed, resulting in six categories: forest, mixed plantation, tea plantation, shrub/bush, agricultural land, and settlement (Table 14.2).
Potential soil erosion was determined using the USLE method (Wischmeier and Smith 1978). This is the most widely used method and the simplest model for predicting soil erosion and still remains the best known because of its scientific basis, ease of use, low cost, and direct applicability in watershed (Sharma et al. 2011). It can be described in the following equation:
A = R x K x L x S x C x P, (14.2)
where A is the annual soil loss (tons ha-1 year-1), R is the rainfall/erosivity factor (mm year-1), K is the soil erodibility factor (t J-1 mm-‘), L and S are slope length and steepness factors, respectively, and C and P are the crop management and conservation factors.
General description

![]()

![]() Areas covered by dense trees with relatively darker green color An intensively managed plantation. It is characterized by a homogeneous canopy structure with single dominant species and regular spatial network and clear-cut boundaries with neighboring vegetation Areas covered by a combination of several woody and fruity plantations such as rubber, Cynnamomun, Mango sp., Durio sp., etc. It is indicated by irregular patterns
Areas covered by dense trees with relatively darker green color An intensively managed plantation. It is characterized by a homogeneous canopy structure with single dominant species and regular spatial network and clear-cut boundaries with neighboring vegetation Areas covered by a combination of several woody and fruity plantations such as rubber, Cynnamomun, Mango sp., Durio sp., etc. It is indicated by irregular patterns
Areas covered by herbs, grass, and nonwoody herbs. These areas usually
correspond to recently opened areas, the first phase of land conversion into both mixed plantation and tea plantation Areas dominantly cultivated by paddy field and potatoes, characterized by inundating of fields from irrigation or rainfall Areas occupied by houses or buildings including road network and other facilities
Source: The Indonesian National Standard No. 7645:2010 by the BSN-National Standardization Agency of Indonesia 2010
Statistical analysis with Pearson’s correlation coefficient was applied to identify the relationship between LULC change and land degradation. In this analysis, the land use category served as the independent variable and the rate of land degradation served as the dependent variable. Because of the difference in scale between land use type (nominal scale) and land degradation class (ordinal scale), the land degradation class needed to be aggregated using the statistics method “summated rating scale.” The next step was bivariate statistics correlation analysis between land use degradation to identify the relationship between LULC change and land degradation.
All image processing, classification, and change detection were performed using ERDAS Imagine 8.7; the GIS analysis was carried out using ArcGIS 10.1. Statistical analyses were conducted using PSAW SPSS Statistics ver. 18.0 for Windows.
14.2 Results


