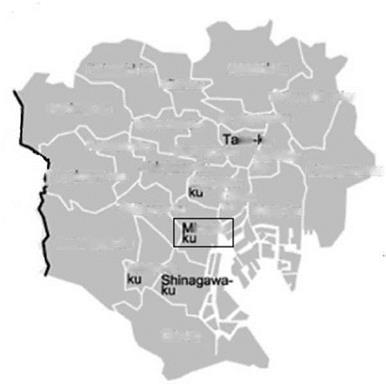
Minato-ku is the ward located in the southeastern part of Tokyo that faces Tokyo Bay to the east (Fig. 2.1). The total area of Minato-ku is 20.34 km2 as of October 1, 2008. As of April 1, 2010, the population of Minato-ku, according to the Basic Resident Registry, was 202,505 residents.
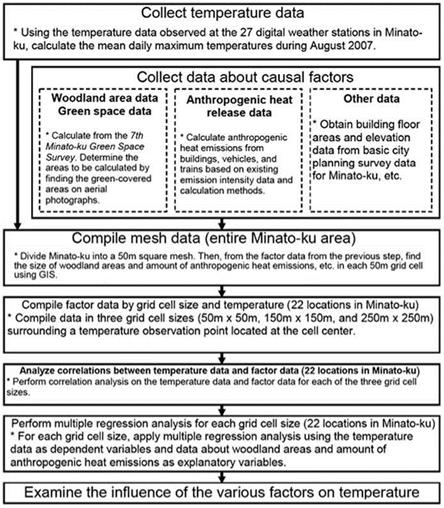
The diagram in Fig. 2.2 shows the procedure used in this study.
The focus of this study was Minato-ku, where the heat island effect was pronounced, as Bureau of the Environment, Tokyo Metropolitan Government (2005), and Minato-ku (2006a, b) pointed out. First, we obtained temperature data in summertime from digital weather stations set up at 1.5 m above ground level at 27 sites in Minato-ku.
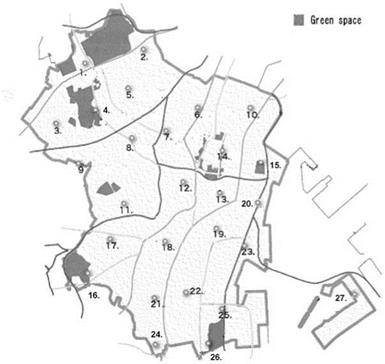
We calculated the mean daily maximum temperature during August 2007 at each site and used these figures as temperature data. Mean values were taken to eliminate confounding factors in the temperature data caused by wind or building orientation, for instance. The observation points at the 27 locations in Minato-ku are shown in Table 2.1 and Fig. 2.3. To plot the temperature data in a 50 x 50 m mesh, we took the mean daily maximum temperature at each of the 27 sites as the data for each grid cell containing an observation point. We then performed surface interpolation of the gridded data using GIS and estimated the temperature distribution over the entire Minato-ku area.
Based on findings noted in the literature about the heat island effect by Ojima (2002), Tokyo Heat Island Mitigation Council (2003), and Moriyama (2004), we collected and compiled data about factors we considered to be relevant to temperature formation: the size of woodlands and green spaces, amount of anthropogenic heat emissions, building floor area, and site elevation. The actual methods used to calculate this factor data and grid it on a mesh are described next.
To calculate green space, we used available GIS data that show green areas. These data were created by identifying vegetation cover from color digital orthophoto data and infrared orthophoto data obtained from the aerial photographic data taken by a digital aerial camera at the time of the 7th Minato-ku Green Space Survey (2006).
 Setagaya-ku
Moguro-
Ota-ku
Fig. 2.1 Location of Minato-ku in 23 wards in Tokyo
In the available data, locations with at least 200 m2 continuous green space had been specifically extracted as “woodlands.” We decided to utilize this existing information. Thus, the green-related factors in temperature formation were classified and organized under two separate categories: “woodlands” and “green space” (comprising areas of vegetation or tree cover, grasslands, green roofs, bare ground, and water features).
In calculating the amount of anthropogenic heat emission, we focused in this study on the emission stage, which has a direct influence on urban air temperatures. We considered the heat released from commercial and residential buildings, and from vehicles and trains, which together account for 90 % of the total anthropogenic heat emissions in Minato-ku. To derive emissions from these sources, we followed the heat emission intensities and calculation procedures described in the report by Ministry of Land, Infrastructure, Transport and Tourism and Ministry of the Environment (2004). Using the appropriate heat emission intensities given in that report, anthropogenic heat emissions were calculated By Building Size and Purpose in the case of commercial and residential buildings, By Vehicle Type, Speed, and Time of Day in the case of vehicles, and By Railway Line in the case of railway heat emissions.
|
Fig. 2.2 Procedural flow |
To derive anthropogenic heat emissions from buildings on this basis, first of all we identified the purpose of each building using the basic city planning survey data for Minato-ku given in the Tokyo City Planning Geographical Information System. The area of each building was found from building polygon data, and this figure was multiplied by the number of floors in the building to give the total floor area. The building floor area was then multiplied by the relevant heat emission intensity unit (building size and purpose) to give the amount of anthropogenic heat released from that particular building.
|
Table 2.1 Observation points at 27 locations
|
Anthropogenic heat emissions from vehicles were calculated from traffic volume and speed data, categorized by time of day, area, and vehicle type in the Road Traffic Census 2005, multiplied by the relevant heat emission intensity unit (vehicle type, speed, and time of day). To derive anthropogenic heat emissions from railways, we calculated the number of trains traveling on each of the railway lines between the stations in Minato-ku, based on the 2006 JTB timetable, and then multiplied those figures by the heat emission intensity unit per railway line to determine the amount of anthropogenic heat emitted on each stretch of railway.
Next, we describe how the various factor data were plotted on a 50-m mesh. Heat emissions from buildings were calculated per structure and plotted as attribute values on a building polygon in the GIS map. By summing the anthropogenic heat emissions from individual buildings, we calculated the total anthropogenic heat emissions from buildings in each grid cell. Where a building crossed the grid cell boundary, the building area was apportioned between the two cells. Anthropogenic heat emissions from vehicles and railways were calculated by area (census area for vehicles; station-to-station for railways) and were assigned in the GIS as
|
Fig. 2.3 Observation points at 27 locations |
polyline attributes representing roads and railways recorded on Digital Map 2500 published by the Geospatial Information Authority of Japan. We divided these data over a 50-m mesh, and then calculated the amount of anthropogenic heat emission from the vehicles and railways in each grid cell.
The floor area of each building was calculated by multiplying the building area by the number of floors, using the basic urban planning survey data for Minato-ku given in the Tokyo City Planning Geographical Information System. The calculations were summed by grid cell.
For the site elevation data, we used data from digital map 50-m mesh elevations (Geospatial Information Authority of Japan).
In analyzing the effects of the various factors on air temperature in this study, because the smallest mesh size used in our study was 50 x 50 m, we decided for convenience’s sake to set three cell sizes (50, 150, and 250 m) encompassing a central temperature measurement point. As shown in Fig. 2.4, if we take the 150-m cell, its factor data are determined by adding the factor data for the basic 50-m cell containing the temperature measurement point (basic cell) to the factor data summed for the eight cells that surround it. The factor data for the 250-m cell are determined by adding the factor data for the 150-m cell to the factor data summed for the 16 cells that surround it in the same manner.
adjoining cells (total 25)
Fig. 2.4 Conceptualization of cell sizes
Next, among the varying temperatures at the 27 observation points, we determined those points where readings were identical and summed the various factor data contained in the 50-m basic cells, 150-m cells, and 250-m cells related to those observation points. In each case we found the mean values by cell size and temperature. That is, we calculated the amount of green space, the amount of anthropogenic heat emissions, building floor area, and site elevation, and performed correlation analysis on this dataset. From the results we determined which factors have the greatest effect on temperature formation, and performed multiple regression analysis on those data.
As the temperature data used for regression analysis in this study, for all cell sizes we used only the readings at the 27 locations in the 50 x 50 m basic cells.


