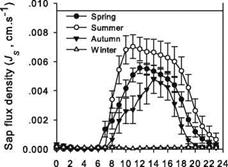
The diurnal patterns of sap flow density (Js) in Chinese pines under sunny weather over four seasons are illustrated in Fig. 4.2a. Maximum Js varied considerably among seasons, ranging from 3.34E-05 to 8.2E-03 cm/s. Diurnal Js exhibited a broad peak pattern in summer and a narrow peak pattern in both spring and autumn, whereas the diurnal pattern was not pronounced in winter. In comparison with the Js pattern in summer, in spring and autumn the timing of the onset and peak of Js were delayed, whereas that of its decline was advanced. The diurnal pattern of sap flow indicated that sap flux density in the Chinese pine had no significant “noon depression” phenomenon. Noticeable sap flow in Chinese pine was evident in the nighttime, which may alleviate plant water stress.
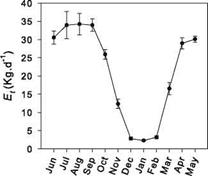
The total transpiration from May 1, 2008 to April 30, 2009 amounted to 6,547.87 kg. Figure 4.2b illustrates the annual variation in Et. The annual pattern
 |
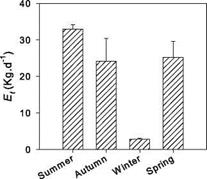
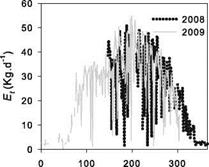
of Et was similar in 2008 and 2009. As shown in Fig. 4.2c, Et increased rapidly from March 7 (8.46 kg/day), reached its peak on July 18 (54.94 kg/day), and then gradually decreased. Figure 4.2d illustrates the seasonal patterns of daily mean whole-tree transpiration. Strong seasonality was observed with Et, which was much greater in the summer (June to August; 32.93 kg/day) than in winter (December to February; 2.78 kg/day), which may be attributed to the lower soil moisture content, vapor pressure deficit, and reduced radiation received in winter. Such seasonality in tree water use is generally observed in temperate and tropical systems (Melanie et al. 2006). Furthermore, Et was much higher during the growing season (April to October) than during the nongrowing season (November to March). The nongrowing season Et of Chinese pine cannot be neglected, as it accounts for about 8 % of the annual Et and maintains the existing living cells. This finding is consistent with the results of Ceschiaa et al. (2002), which revealed that, during the nongrowing season, maintenance respiration of adult beech (Fagus sylvatica) trees ranged between 7.2 and 528 ^mol/m3/s at breast height and in the upper crown, respectively.
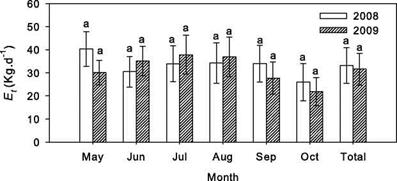
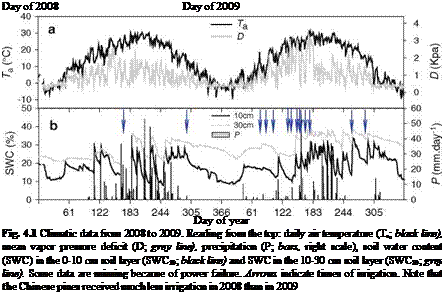
Statistical analysis showed that both the monthly Et and average Et (33.16 vs 31.61 kg/day) during the growing season (May to October) did not differ significantly in 2008 and 2009 (Fig. 4.3). Such maintenance of interannual variation of Et was also observed in a pine forest and in an eastern Siberian larch forest (Ohta et al. 2008; Phillips and Oren 2001). However, there were obvious annual variations in tree water use observed in an open woodland of two co-occurring
|
|
||
|
|||
|
|
||
|

|
Table 4.3 Chinese pine tree transpiration in suburban and central Beijing
|
species (a coniferous Callitris species and a broad-leaved Eucalyptus species), in a 19-year-old Acacia mangium plantation and in a Mediterranean Quercus ilex forest (Limousin et al. 2009; Ma et al. 2008; Melanie et al. 2006).

