In Sect. 3.6 we discussed different models with which populations can be simulated. in contrast to the direct specification, here the plant distribution is the result of the production algorithm that replicates the development history of a population. The goal is to obtain a simulation of a population in a balanced condition, and to transfer it into images. In the following we will take a closer look at the implementation of two such models. Both were used to generate synthetic plant ensembles. The first deals with a single population, while the second simulates an entire association.
An essential process in a population is the competition for the resources such as light. This process leads to typical changes in a population over time, which are simulated here. In the next paragraph, this is extended to a plant association with several species and locally varying growth conditions.
Typically, the number of plants in a population decreases after a certain time due to the growth of the individual plants. According to Eqn. (3.17), which described this process, the density of a population reaches a maximal value, and then stabilizes itself.
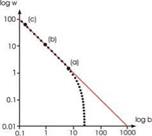
 Figure 8.5 Number and weight (both in logarithmic scale) of a population according to the power law. The marked states correlate to the respective parts of Fig. 8.6.
In actual plant populations, this maximal density Dm does, however, change over time. The taller the individual plants grow, the less individuals can survive per region, since the quantity of resources (light, water, nutrition) is limited. Dm can empirically be determined using
w = bDmk, (8.3)
where w is the average dry weight per plant, and b is a constant. By applying the logarithm, the more typical notation is obtained
log w = log b — к log Dm, (8.4)
or
![]() B = log w + к log Dm.
B = log w + к log Dm.
In this equation, B = log b and к are constants with к having the value of approximately 3/2. If we draw the logarithm of the plant density against the logarithm of the average dry weight, a straight line results (see the solid line in Fig. 8.5). This relation was first described by Yoda et al. [235]; it is called the law of the -3/2 power.
 Figure 8.6
Simulated growth of a plant population following the self-thinning process.
Red plants die, light-green plants are dormant (courtesy of P. Prusinkiewicz)
(a) (b) (c)
![]() In a simple simulation process, plants are randomly distributed on a plane in the form of a small circles with a random diameter [61]. The growth takes place through a successive increase of the circles. If two circles collide, the smaller of the corresponding plants “dies”. Plants that reach a certain height become dormant, and later die also.
In a simple simulation process, plants are randomly distributed on a plane in the form of a small circles with a random diameter [61]. The growth takes place through a successive increase of the circles. If two circles collide, the smaller of the corresponding plants “dies”. Plants that reach a certain height become dormant, and later die also.
At the beginning of the simulation, the sum of the logarithmic dry weight and the plant density is below the maximal value given by Eqn. (8.5), that is why the seeds at first develop unconfined. As the graph approaches the straight line, the number of plants decreases until the modification of the population only takes place along the line given by the power law. Figure 8.6 demonstrates this kind of self-thinning process in a part of the population. Starting with 20,000 young plants in total, here shown are three stages of the population.


