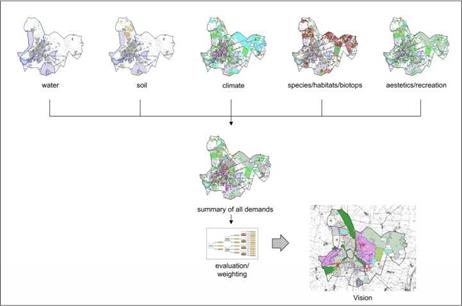
Based on the inventory and evaluation process objectives and if necessary alternative objectives must be developed (Bfn 2002; von Haaren, 2004). A methodology to meet these requirements is to define for each landscape function (e. g. species/habitats/biotopes) two categories. All patches in the first category are most suitable for the defined function. All other land use types have no negative effect (e. g. habitats of endangered species). The second category involves patches with high relevance that has to be weighted with other functions (e. g. parks with relevance for endangered species and recreation). Defining all these categories and selecting the different patches might be very complex. GIS may help selecting the specific areas and create a summary of all demands. Based on these information using weighted overlay algorithms the vision and objectives can be defined (see
Fig. 16).
Creating maps step-by-step in consideration of the defined criteria the discussion with decision-makers, public, stakeholders and experts can be improved. In town meeting or participation using internet technologies it’s easier to understand the analysis and the requirements for each category and landscape function. During an interactive presentation different scenarios might be tested and the results can be visualized. Transparency can be increased and general agreement achieved.
Based on the defined objectives specific ad spatial concrete measures must be planned (Riedel & Lange, 2001; von Haaren, 2004; BfN, 2002). The results should be implemented in standardized environmental information systems to ensure the possibility for implementation, update and monitoring as well as publishing using Web services for other planning tasks or following working steps.
|
Fig. 16. Generating a vision based on weighted overlay of different plan concepts 4. Information management |
In the past there had been a lot of problems exchanging information in horizontal and vertical ways between different planners and different landscape planning procedures (Kramer, 2008; Dembinsky, 2008; Arnold et al., 2005; Pietsch et al. 2010). In the context of environmental planning the whole planning process can be described as a life cycle of information (see Fig. 17).
To improve data exchange standardized, conceptual data models had been created e. g. for various areas of roads and transport (Hettwer, 2008) or regional, municipal land management and landscape planning in Germany (Benner et al. 2008; Benner & Krause,
2007) . The purpose is to ensure a consistent object representation and a unified data exchange of graphic and geometric data (Ernstling & Portele, 1996; Hettwer, 2008; Pietsch et al., 2010; a. o.). The defined data models allow software developer to create specific application for landscape planning purposes and develop interface for data exchange.
For the representation guidelines and standard maps for different purposes had been developed to achieve a unified design in creating maps (Schultze & Buhmann, 2008). Taking the communication model of Norbert Wiener (Steinitz, 2010) in consideration defining and using data models lead to standardized communication without loss of information and meaning and improves data quality (Pietsch & Heins, 2009; Heins & Pietsch, 2010; Hettwer,
2008) . Otherwise producing standardized datasets allows the implementation and development of Web GIS-applications for public participation or in monitoring / environmental information systems. Validation checks may be implemented to ensure data quality and to guarantee integrity. This allows to choose and develop scientific (process, evaluation, change, impact, decision) models for the planning process (Flaxman, 2010). Therefore existing data models must be extended using actual technical (e. g. OGC) and functional (e. g. guidelines, standard maps) standards. This might cause to a homogeneous terminology for planners and designers and a consistent presentation of results in the decision-making process. First steps had been done and some examples exist, but there is a lot of research to do to become these things reality.
|
Fig. 17. Cycle of information in the context of landscape and road planning (Pietsch et al., 2010) |


