The results of the landscape planning process are planned objectives or planned measures to be implemented into town and country planning, sectoral plans or executed by executive agencies (e. g. public institutions, conservation authorities, private individuals) (BfN, 2002; Riedel & Lange, 2001). Therefore landscape planning must be extended from an expert planning to a process-oriented planning where the participation process is one of the most important topics (Steinitz, 2010; von Haaren, 2004; Wissen, 2009). Based on the communication model of Norbert Wiener (Steinitz, 2010) the process has three elements: the message, the medium and the meaning. In landscape planning that means that the planner has a vision (a plan), the landscape is the medium and the viewer (public, stakeholder etc.) gains an impression of the changed landscape. In existing planning processes often the communication starts by the designer and ends by the viewer. But there must be a two-way alternate communication between the designer and the viewer to improve the results and the acceptance (Wissen 2009; Steinitz 2010; a. o.) (Fig. 11).
|
Fig. 11. Nobert Wiener’s Communication Model (Steinitz, 2010) |
Communication and information are the basic elements of participation (Warren – Kretzschmar & Tiedtke, 2005; Wissen, 2009). The advantages of computer-generated visualizations (plans, photomontages, 2D visualizations, 3D visualizations, real-time visualizations) in decision-making processes have been recognized for a long period (Lange 1994; Al-Kodmany 1999; Warren-Kretzschmar & Tiedtke 2005; Wissen 2009 a. o.). There are a lot of different media or visualization techniques that can be used for citizen participation (see table 2.). For non-experts it’s often difficult to understand the planning ideas. On the other side it’s necessary for the planner to express and communicate his thoughts in order to promote more sensitive landscape managing (Buhmann et al. 2010).
|
Dynamic navigation |
Interactivity (of image) |
Photorealistic |
GIS- supported |
Internet |
|
|
Interactive maps/ Aerial photos |
+ |
– |
-/+ |
++/- |
++ |
|
Panorama photos |
+ |
– |
+ + |
– |
+ |
|
Photomontage |
– |
+ |
+ + |
– |
+ |
|
Sketches |
– |
+ + |
– |
– |
– |
|
Rendering of 3D-Model |
– |
+ |
+ |
+ + |
+ |
|
VRML |
+ + |
– |
+ |
+ |
++ |
|
Real-time |
+ + |
+ |
+ + |
+ + |
– |
|
Legend: – unsuitable, + suitable, ++ very suitable Table 2. Overview of visualization methods and their attributes (see Warren-Kretzschmar & Tiedtke, 2005) |
But in all cases the questions remain:
– "Which characteristics of the visualizations are crucial for the support of citizen participation in the planning process?
– Which of the visualization methods are best suited for the different landscape planning tasks?
– How can visualization be successfully employed in citizen participation activities, both online and offline and which organizational aspects are important?" (Warren – Kretzschmar & Tiedtke, 2005).
Using appropriate techniques and media it’s possible to explain complex environmental issues to layman. The combination of modeling techniques and GIS permit to open a "window to the future" to show scenarios, 3D – and 4D-simulations in different level of details and realism (Sheppard et al., 2008; Bishop & Lange, 2005; Paar & Malte, 2007; Sack-da Silva, 2007; Schroth, 2010; Pietsch & Spitzer, 2011).
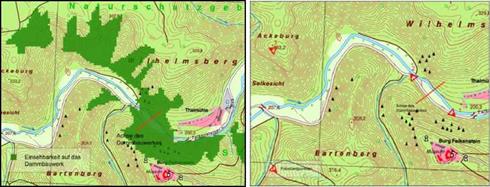
A possibility to analyze relevant observation points for detailed visualizations are GIS based viewshed analysis. Digital Elevation Models (DEM) in combination with actual landform based on topography maps, orthophotos or thematic land use maps can be analyzed to select important vistas and areas from which a specific project might be visible or which area might be affected realizing a specific project (e. g. in the context of impact assessment for wind turbines) (see Fig. 12). After calculating the results they can be checked in the field and detailed visualizations of the before and after situation can be developed (Buhmann & Pietsch 2008a).
|
Fig. 12. Viewshed analysis (areas in green from which proposed dam in red is visible) (left); seleceted observation points for detailed visualization (right) (Buhmann & Pietsch, 2008a) |
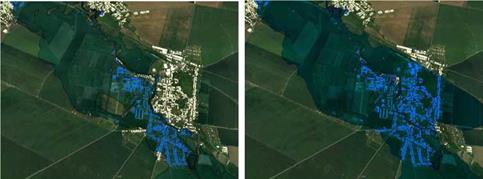
Creating a 3D model of the investigation area enables to calculate scenarios and simulations through the integration of GIS data and generated 3D models (e. g. buildings, plants). Visual impact assessment or aesthetic analysis (Kretzler, 2003; Ozimek & Ozimek, 2008; Bishop et al., 2010) are possible as well as calculating affected settlements by different levels of flooding and evaluating different measurements to reduce the impact (see Fig. 13) (Buhmann & Pietsch, 2008a). Using these techniques different landscape ecological impacts can be spatially defined, evaluated and visualized.
|
Fig. 13. Simulation of affected areas (blue) and not affected areas (white) during a flood 1994 (right); simulation with planned dams (right) (Buhmann & Pietsch, 2008a) |
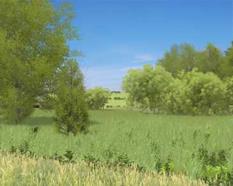
In detailed scale seasonal changes can be presented and discussed and visual impact analysis based on temporal changes can be evaluated especially in sensitive (e. g. areas with a high touristic potential) areas (see Fig. 14).
 |
 |
For public participation processes planning results can be presented interactively in realtime for offline or online purpose (Paar, 2006; Paar & Malte, 2007; Buhmann & Pietsch 2008a and b; Warren-Kretzschmar & Tiedtke, 2005; Wissen, 2009; Kretzler, 2002; a. o.). Visualization using different media and specific level of detail is a useful methodology to explain the results of the different working steps as well as to explain complex ecological issues in a way everybody (experts, public, stakeholder, politicians) is able to understand. In the context of Wieners communication model visualization techniques are a possibility to improve the meaning and understanding of the planers vision (Wissen, 2009).
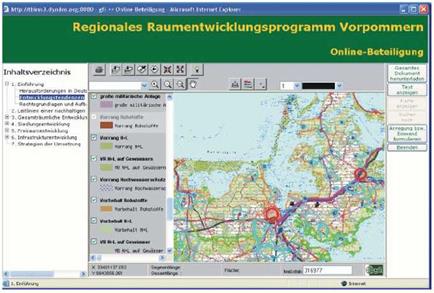
To create a two-way alternate communication between planer/designer and viewer Web GIS-technologies can be used (Warren-Kretzschmar & Tiedtke, 2005; Lipp, 2007; Richter, 2009). Through Web GIS-technologies it’s possible to present spatial information via the internet, combine them with other media (Dangermond, 2009) and offer GIS capabilities (e. g. zoom, pan, spatial analysis, upload and download, network-analysis, editing) to enhance the communication process. Thematic maps using WebMap – or WebFeature – Services can be presented via Internet (Richter 2009; Krause 2011). In the landscape planning context the thematic maps and the belonging text explaining the landscape functions, conflicts, the guiding vision and objectives and measures can be published. Users can be enabled to navigate through the whole documents and give feedback using drawing or editing tools to locate the response and the possibility for textual information (see Fig. 15). All these information can be stored in a database to analyze the results of the public participation process, to redesign the plan and if necessary to reply to each of the user.
In combination with visualization techniques the communication between planner/designer and viewer can be improved. In addition to town meetings or specific workshops much more people can be involved using these techniques. Especially for landscape planning projects on regional level or for the entire state it might be helpful to improve the participation process simultaneously reducing planning period and costs.
|
Fig. 15. Screenshot public participation server (Richter, 2009) |


