Defining "what is in a pixel?" numerically, very important for understanding the earth surface in remote sensing science. Increased spatial information may be valuable in a variety of situations. The forthcoming range of satellite spectrometers (e. g. MODIS, MERIS) provided detailed attribute information at relatively coarse spatial resolutions (e. g. 250m, 500m, 1km) (Aplin and Atkinson 2001).
Traditional hard per-pixel classification of remotely sensed images is limited by mixed pixels (Cracknell 1998). Soft classification overcomes this limitation by predicting the proportional membership of each pixel to each class. Mapping is generally achieved through the application of a conventional statistical classification, which allocates each image pixel to a land cover class. Such approaches are inappropriate for mixed pixels, which contain two or more land cover classes, and fuzzy classification approach is required (Foody 1996).
|
|||||||||||||||||||||||||||||||||||||||||||||||||||||||||||||||||||||||||||||||||||||||||||||||||||||||||||||||||||||||||||||||||||||||||||||||||||||||||||||||||||||||||||||||||||||||||||||||||||||||||||||||||||||||||||||||||||||||||||||||||||||||||||||||||||||||||||||||||||||||||||||||||||||||||||||||||||||||
Fuzzy logic models constitute the modeling tools of soft computing. Fuzzy logic is a tool for embedding structured human knowledge into workable algorithms. There are two main types of sets. The ‘crisp (or classic) sets’ and the ‘fuzzy sets’. For example, a crisp set can be defined by a membership function:
In crisp sets a function of this type is also called characteristic function. Fuzzy sets can be used to produce the rational and sensible clustering. For fuzzy sets there exists a degree of membership ps(X) that is mapped on [0, 1]. In the case of LUC map, every area simultaneously belongs to interest LUC clusters with a different degree of membership (Kandel, 1992).
1 if X є S
![]() hs(X)
hs(X)
There are several soft classification techniques and these are variable according to training and testing dataset, scale of the study. In this frame, linear mixture modeling (LMM), Regression tree (RT), multi linear regression (MLR) and artificial neural network (ANN) soft classification techniques were evaluated in Eastern Mediterranean area called Upper Seyhan Plane (USP). Berberoglu et al. (2009), was focused on these four soft classification techniques to map percentage of tree cover using ENVISAT MERIS (full spatial resolution 300m) dataset and vegetation metrics. These metrics and more information about ancillary data integration were discussed in section 5.
For the accuracy assessment of a LUC or fuzzy map, we need to get high resolution ground truth data. Crisp data is adequate for the hard classifications, however assessment of a soft classification needs fuzzy ground truth like real forest cover in study scale quantitavely. High spatial resolution Ikonos (4m) satellite images of three selected plots were used to derive training and testing ground data. Ikonos images were classified as forest and nonforest classes and, results rescaled to MERIS spatial resolution. 80% of this tree cover dataset was used as training data and 20% were separated for accuracy assessment. Linear (LMM and MLR) and non-linear (ANN and RT) techniques were compared.
LMM is one of the most used fuzzy techniques in the literature (Berberoglu & Satir 2008) and based on the assumption that class mixing is performed in a linear manner and therefore adopts a least squares procedure to estimate the class proportions within each pixel. The idea is that a continuous scene can be modeled as the sum of the radiometric interactions between individual cover types weighted by their relative proportions (Graetz 1990). The form of mixture model is:
 |
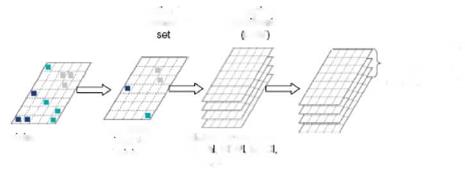
 Fig. 9. Methodology for application of LMM
MLR refers to relating a response variable Y to a set of predictors xi in the form (e. g.Chatterjee and Price, 1991):
Y = b0 + bl. xl + b2.x2 + ….+ bp. xp (4)
Where the b0 is the constant value and b1 refers to coefficient of the first variable x1 (waveband). An advantage of linear regression is that it is easy to implement. MLR models are computationally efficient and can also predict confidence intervals for the obtained coefficients and the predicted data. Some of variable was eliminated using stepwise regression models.
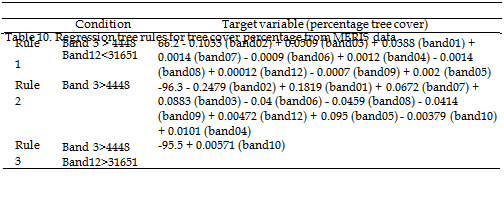
The RT method has in recent years become a common alternative to conventional soft classification approaches, particularly with MODIS data (Hansen et al. 2005). The basic concept of a decision tree is to split a complex decision into several simpler decisions that can lead to a solution that is easier to interpret. When the target variable is discrete (e. g. class attribute in a land cover classification), the procedure is known as decision tree classification. By contrast, when the target variable is continuous, it is known as decision tree regression. In an RT, the target variable is a continuous numeric field such as percentage tree cover. Splitting algorithms were introduced in data dependent classifiers section. Splitting rules were contained only crisp equations. However, splitting rules were contained regression equation for each rule additionally in RT. In this study fallowing RT rules were applied to derive tree cover percentage (table 10).

 Correlation coefficiencies of each result with testing dataset from LMM, MLR, ANN and RT were 0.68, 0.69, 0.68 and 0.71 respectively. The most accurate result was obtained using RT technique.
These techniques are not only used to map two classes but also can be applied for more LUC class. In this frame, LMM and ANN fuzzy classification techniques were compared in almost same area as RT classification by §atir (2006) (figure 10). Only forested areas were selected in §atir’s study. Training and testing dataset were derived from Landsat TM/ETM for each LUC.
Adana c:
![]() Mediterranean se;
Mediterranean se;
Fig. 10. Study area boundary for LMM and ANN fuzzy classifiers comparison.
 |
 |
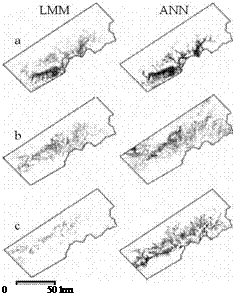
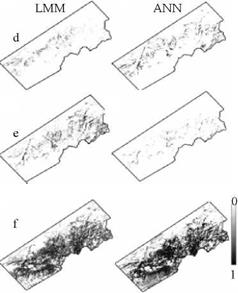
Turkish pine (pinus brutia), Crimean pine (pinus nigra), Lebanese cedar (cedrus libani), taurus fir (abies cilicica) and juniper (juniperus excelsa) were classified in detailed classification scheme. In addition, bareground, farmlands, forestlands and water bodies were classified in general classification scheme. LMM, ANN fuzzy classifications and ANN hard classification results were compared to see hard and soft classification accuracy difference and the best fuzzy classification technique (figure 11).
Fig. 11. Soft classification results (a: Turkish pine, b: Crimean pine, c: Juniper, d: Lebanese cedar, e: Taurus fir and f: General soft classification of forest).
LMM and ANN fuzzy classifications using medium spatial resolution data (300m) resulted reasonable classification outcomes if the training data set is large enough. On the other hand, in general both fuzzy classifications were more accurate than the hard classification results (table 11).
Fuzzy classifications are ideal for LUC mapping using coarse or medium spatial resolution data. However, fuzzy classification is not necessary in LUC mapping using very high spatial resolution data (e. g. 0.5m or 1m). High spatial resolution data have the characteristic that group of pixel shows the similar spectral characteristics. Object based classification techniques are suggested in this point.


