One of the most effective ways of assessing the environmental impact of a particular process or product is to find out how much non-renewable energy is required to produce it; this quantity of energy is referred to as embodied energy. The consumption of embodied energy results in the emission of greenhouse gases, which contribute to global warming and climate change. So embodied energy can be thought of as a shorthand for assessing the climate change potential of a process.
Another important reason for finding out how much energy different processes and products use is to judge how equitably the world’s resources are distributed. In 1985 the per capita carbon dioxide emissions for someone living in Africa was
0. 79 tonnes per annum while the corresponding figure for someone living in the USA or Canada was 19.21 tonnes per annum (Shorrock and Henderson, 1989).The challenge lies in reconciling the need for reducing emissions of greenhouse gases and the imbalance in access to energy between developed and developing regions. Most people would prefer this imbalance to be evened out by a general improvement in the living standards of those with the least access to resources. A variety of mechanisms can achieve this end, all requiring access to energy, and if you think, as we do, that conventional nuclear power is not an attractive and safe longterm solution, then the only option is to use renewable energy and reduce the amount of energy required for processing goods and activities. The need to reduce embodied energy applies as much to food production as to the energy efficient operation of buildings and other activities.
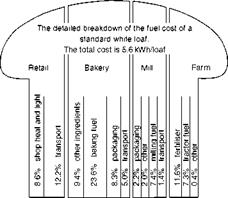
Figure 3.1 was published by Peter Chapman in 1975 and illustrates the embodied energy for a loaf
of bread (Chapman, 1975).This is typical of a number of studies conducted in the 1970s, undertaken in response to the rapid increase in the price of oil, and fear over the impact this and possible oil shortages, would have on the economies of developed countries. Between then and the Rio Earth Summit in 1992, very little attention was paid to embodied energy.
In Britain, the first widely published attempt to assess the embodied energy of food was made by the architects Brenda and Robert Vale (Vale and Vale, 2000).They tried to estimate the non-renewable energy use resulting from food consumption for a family of four, living in England. This was compared to the family’s energy usage in their house and for the typical usage of a family car. This study took as a starting point the recommendations for daily calorie intake by the Food and Agriculture Organisation
of the United Nations. The energy content of food was estimated using United Kingdom data from 1968 published by G. Leach (Leach, 1976). It is clear that the figures used in this calculation are out of date and that the embodied energy of food may have altered. For example, packaging and transportation have almost certainly increased, while production and processing may have become more energy efficient. Notwithstanding these uncertainties, the Vales’ findings are sufficiently surprising to cause concern.
They estimated that the embodied energy content of food consumed by the family of four was 265 kWh/m2, while the delivered energy used by a typical house in the United Kingdom was estimated at 257 kWh/m2. In both cases, to allow for comparison between houses of different sizes, the total energy used per year was divided by the floor area of the house.
|
|
 |
|

Figure 3.1 The embodied energy of a loaf of bread.
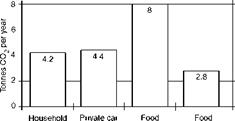
Figure 3.2 Carbon dioxide emissions for a typical family in the UK.
car and a standard house built in England in 1995. Figure 3.2 also includes estimates from a Dutch study for household greenhouse gas emissions resulting from food consumption (Kramer K. J. etal.,
1999) .
The study by Kramer et al. was detailed and used contemporary figures to estimate emissions resulting from the lifecycle for food production and consumption. Kramer et al. estimates that the food consumed per year by an average household resulted in 1875 kg of carbon dioxide emissions. When other non carbon dioxide greenhouse gas emissions resulting from food production are allowed for, then annual household food consumption emits the equivalent of 2800 kg of carbon dioxide. A carbon dioxide equivalent refers to the amount of carbon dioxide that would have to be emitted to equal the global warming potential of another greenhouse gas. In the case of food this refers to the greenhouse gases methane and nitrous oxide.
Kramer et al.’s study indicates that the global warming potential resulting from the consumption of industrialised food production in the Netherlands is about equal to the emissions for all energy use in a typical modern home. For comparison, circa 2600 kg of carbon dioxide emissions result from space heating, domestic hot water use, cooking and the use of pumps and fans in a typical four person house built in the UK to thermal standards applicable between 1995 and 2002 (DETR, 1998).
The Dutch study suggests that carbon dioxide equivalent emissions are about 40 per cent of those estimated by the Vales. Given the number of variations between the two calculations it is difficult to make a direct comparison. The Vales’ calculation is based on a household of four persons which is probably larger than the national average household in the Netherlands, and the Vales’ embodied energy data is much older.
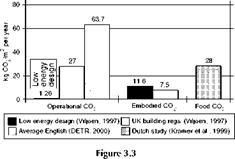
Another way of assessing the relative importance of greenhouse gas emissions from food production is to compare them to emissions from the embodied energy of buildings. Figure 3.3 assumes a house with a floor area of 100 m2 for four persons. From Figure 3.3, using Kramer et al.’s figures for carbon dioxide emissions due to food consumption, it can be seen that the embodied energy of food is significantly greater than the embodied energy of dwellings. (The embodied energy of dwellings has been calculated as an annual equivalent figure, by dividing the embodied energy of building materials by their lifetime.)
Overall these estimates for the embodied energy and associated greenhouse gas emissions of food are startling, particularly since the energy usage associated with agriculture is usually considered to be relatively small. Europe provides a useful illustration since its per capita energy use falls between that of the highest consumers, the USA and Canada, and the lowest, Africa (Shorrock and Henderson, 1989). The United Nations Framework Convention on Climate Change states that between 1990 and 1997 agriculture contributed less than 1 per cent to total carbon dioxide emissions, rising in 1998 to 1 per cent (European Environment Agency, 2002).
|
|
Figure 3.3 Embodied and operational carbon dioxide emissions for a typical household in the UK compared to embodied carbon dioxide emissions from food consumed by a household. The embodied emissions for food are based on a Dutch study.
How is it that estimates by some researches claim such a high environmental impact for food production when the carbon dioxide emissions from agriculture appear to be so low?
One reason is that the energy usage on a farm is but one part of the food production cycle. Agricultural energy usage will not take account of the transport required to shift crops from farm to point of sale, and from point of sale to point of consumption. In addition, food in Europe and other developed countries is undergoing a considerable amount of pre sale processing and packaging. Even uncooked fruit and vegetables are frequently sold pre-cut and ready to eat, not to mention the energy used to keep semiripe fruit and vegetables refrigerated.
Another significant contributor to greenhouse gas emissions from industrialised agriculture arises from the use of fertilisers. It has been estimated that the energy used in the industrial production of fertilisers and pesticides accounts for 1.5 per cent of the United Kingdom’s carbon dioxide emissions. Once fertilisers have been applied to crops further emissions of nitrous oxide occur, a greenhouse gas 310 times as powerful as carbon dioxide. The same estimates suggest these emissions are more than twice as significant as the carbon dioxide arising from the production of fertilisers (Stanley, 2002). One must assume that these significant greenhouse gas emissions are excluded from the agricultural category, and included under emissions from industry.
Using statistics from a range of national institutions, Stanley has suggested that if food in the United Kingdom were produced organically, consumed locally and eaten when in season, greenhouse gas reductions in excess of 40 million tonnes of carbon, per annum, could be achieved. This would represent a reduction of 22 per cent of current carbon dioxide emissions from the United Kingdom. This is put into perspective when it is realised that this reduction is in excess of twice the commitments made by the
United Kingdom under the Kyoto Protocol (Stanley, 2002). Similar reductions in greenhouse gas emissions can reasonably be assumed for other nations using industrial agricultural production.
The above study shows how important it is to take account of the entire lifecycle of any product or activity. The principles of organic agriculture, local trading and seasonal consumption of food form one of the central underpinning arguments in support of urban agriculture and productive landscapes. Stanley’s timely estimates provide a powerful environmental argument in favour of urban agriculture.
Given the significance of these assertions it is necessary to further investigate the environmental consequences of adopting urban agriculture. Our definition of urban agriculture within continuous productive landscapes assumes the following:
• Organic agriculture
• Seasonal consumption
• Local growing and trading of crops.


