Almost every day we encounter objects that captivate us by their form, function, colour and craftsmanship. Sometimes, these are objects designed by famous designers. We wonder then why a given object looks so good and why we like it.
![]()
|
Other times, we see furniture manufactured in past periods and with astonishment we ask ourselves the question of how “they” did it? Usually, the answer to this question is to understand the principle of proportional distribution.
The oldest examples of the occurrence of the principle of proportional distribution are the works of nature, including the shape of galaxies, flowers, plants, snail shells and pine cones. The Egyptians used the rule of the golden ratio 2700 years before Christ. We know that the Pythagoreans knew the rule of golden ratio as early as 500 B. C. However, mathematically, this rule was described for the first time by Euclid in his most important work Elements (Book 6, Proportions, 300 B. C.). He stated that there is such an excellent division of a section, in which the ratio of the length of the smaller part to the length of the larger part is identical to the ratio of the larger part to the whole, while the value of this coefficient shows the proportion of 0.61803389…: 1. The obtainment of this value can be explained by Fig. 3.7 and the following equations. First, we divide any section into two unequal parts, indicating the longer section by x, the shorter by (1 – x) and the ratio x/(1 – x) as ф (phi).
Then, let us create the proportion in the form of:
(3.1)
By multiplying both sides by x and regrouping the expressions, the above equality is reduced to the form of the overall square equation:
x2 + x — 1 = 0. (3.2)
It has two real solutions:
![]() —1 ± vS
—1 ± vS
x1,2 =
of which one is positive:
Hence, the number of the golden ratio (phi) is:
x
U = = 1; 6180342… (3.5)
x — 1
The number ф is sometimes also referred to as the golden number. Further, approximations of the value of this number can be obtained by calculating the quotients of adjacent Fibonacci numbers: 0, 1, 1, 2, 3, 5, 8, 13, 21, 34, 55, 89, 144, 233, which gives subsequently: 0, 1, 2/1, 3/2, 5/3, 8/5, 13/8 21/13, 34/21, 55/34, 89/55… ^ ф. Already, the last of the fractions listed here gives an approximation of the golden number to the nearest 0.001.
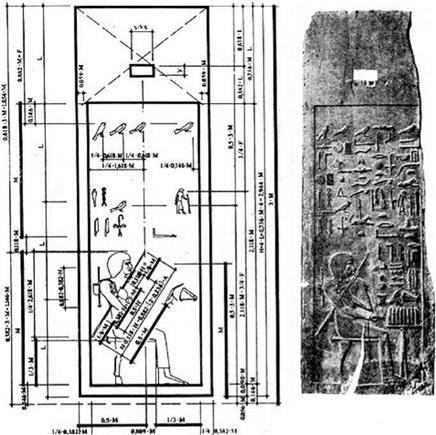
At the beginning of the twentieth century in Saggara (Egypt), archaeologists opened a crypt, which contained the remains of the Egyptian architect Khesi-Ra (Shmelev 1993). The historical text on the crypt indicated that Khesi-Ra lived in the period of Imhotep, that is during the reign of Pharaoh Djoser (2700 B. C.). The figure of the architect was presented surrounded by different figures in different proportions. Initially, Egyptologists acknowledged the descriptions on the crypt as unreadable and incomprehensible. Only in the 1960s, after conducting many tedious analyses and comparisons, did Egyptologists agree that on the crypt there is an inscription of the principle of the golden ratio (Fig. 3.8).
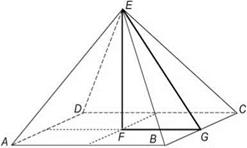
It threw new light on the technical culture of ancient Egypt. And since the inscription concerns the period of the reign of Pharaoh Djoser, it is very likely that the pyramid of Djoser was the first experimental construction designed under the leadership of Khesi-Ra. The later pyramid of Pharaoh Khufu from 2560 B. C. is also an example applying the rule of the golden ratio by builders. Putting together the individual dimensions of the structure (Fig. 3.9), it can be noticed that (FG)/ EG = 230.36/(2 * 186.47) = 0.61768664. This gives the value of the coefficient ф = 1.6189439. This result differs from the value of the golden ratio number only by 0.005622 %.
In 1202, the Italian mathematician Leonardo Fibonacci completed his work entitled Liber abaci. In the third part of this book, he studied the problem of a series of specific numbers, which along with the increase of their value provide an identical quotient as the coefficient value of the golden ratio. That is why Fibonacci described the solution of a certain problem that occurs in nature, namely a man put into a box with four enclosed walls a pair of rabbits and asked the question, how many pairs of rabbits will one pair provide during a year, if presumably every month each pair breeds a new pair, which in the second month becomes fertile? By explaining the population problem of rabbits, Fibonacci arranged a string of numbers fulfilling the following pattern:
|
Fig. 3.8 The tombstone crypt of the architect Khesi-Ra (Saggara, Egypt 2700 B. C.). Source Shmelev (1993): Phenomenon of the Ancient Egypt. Lotaz, Minsk) |
|
Fig. 3.9 The dimensions of the pyramid of Khufu 2560 B. C.: EF height to theoretical tip = 146.73 m, EG average height of the side wall = 186.47 m and 2FG average length of side = 230.36 m |
1 = 1 + 0;
2 = 1 + 1;
3 = 2 + 1;
5 = 3 + 2;
8 = 5 + 3;
13 = 8 + 5;
21 = 13 + 8; 34 = 21 + 13;
By dividing any number from the series by the number directly preceding it, Fibonacci obtained a value of the quotient close to the number of the golden ratio. These dependencies can also be presented in the form of spirals of the golden ratio (Fig. 3.10).
The rules of reproduction of the herd of rabbits adopted by Fibonacci can also refer to other objects of nature: trees, flowers, shells, fruit, as well as systems of stars and galaxies. The drawing (Fig. 3.11) illustrates a tree, which grows similarly to how rabbits reproduce. Each branch during the first year only grows and in each following year releases one young branch.
The number of petals of many flowers, including the popular daisies, is generally Fibonacci’s number and amounts to 3 or 5, or 8, or 13. An even more surprising result is given by observations of the distribution of leaves on twigs and branches on the boughs of oak. It can be observed that not all the leaves lie one above the other, but twigs similarly. On the contrary, they arrange along a straight line, rather than along the spiral (helix), which orbits the stalk. The cycle of this curve is called the distance of the leaves embedded exactly one above the other, along the branches
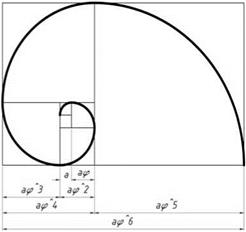 Fig. 3.10 Golden spiral (helix)
 |
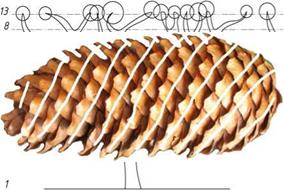 |
or stalks. The helix of a given plant can be characterised by two numbers: the number of rotations of the helix cycle around the branch or stalk and the number of intervals between subsequent leaves lying over one another. It turns out that for very many plants, these two numbers are Fibonacci numbers. For example, the tree of the beech has a cycle consisting of three leaves and performs one rotation, and the American willow has a cycle consisting of 13 leaves and performs 5 rotations. Another example of the occurrence of Fibonacci numbers in nature, well known to people working with trees, is a layout of scales in pine cones. The drawing (Fig. 3.12) illustrates a pine cone, on which spirals can be observed and created by its scales. These spirals can be dextrorotatory or laevorotatory. The pine cones of even the same pine species do not always have the same number of spirals, and also, laevorotatory or dextrorotatory do not always prevail. But in most cases, they are arranged along the spirals, in which number parameters strictly correspond to consecutive Fibonacci numbers.
So how can the rule of the golden ratio be used in furniture design? In furniture for the living room, bedroom, dining room etc., the only limitations are the anatomic dimensions of the selected population constituting future users of this furniture. For this group of furniture, one can use one’s imagination in creating forms and choosing proportions. The process of designing furniture, which should be integrated in the environment of technical objects, such as dishwashers, refrigerators, sinks and dryers, is somewhat different. So, let us take a look at the following
Fig. 3.13 The design of the system of fronts of drawers in the attempt to unify their dimensions
two examples of designing proceedings, which aim to propose a system and dimensions of the fronts of drawers (with a total height of 71 cm) in a kitchen cabinet with the dimensions: height 82 cm and width 42 cm.
For the manufacturer of furniture, the most convenient would be an equal division of the height of 71 cm in 4 equal parts. For calculating the height of one drawer front, we would then use the formula:
4h + 3s = 71; (3.6)
where
h height of one drawer front,
s width of the gap between the fronts of the drawers, e. g. 0.3 cm, which gives h = 17.525 cm.
Obtaining such a dimension in the production process is not possible; therefore, the manufacturer shall unify the dimensions of the first three drawers to a height equal to 17 cm and increase the height of the bottom drawer to 19.1 cm (Fig. 3.13).
By applying the golden ratio principle, the fronts of the drawers can be planned out using the following formula:
h1u3 + h1u2 + h1u + h1 + 3s = 71, (3.7)
|
which gives
|
By bringing the obtained dimensions to the technology requirements, the heights of the fronts of drawers should correspond to the markings provided in Fig. 3.14.
Fig. 3.14 The design of the system of fronts of drawers taking into account the golden ratio principle
![]()
![]()
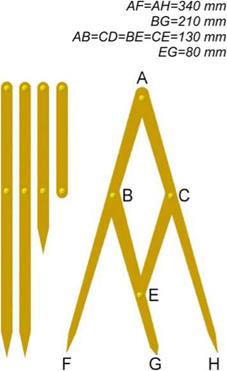 Fig. 3.15 Construction of Fibonacci’s compass
From a practical point of view, the designer-constructor of furniture should be equipped with IT tools (CAD system) supporting the design practice of the golden ratio methodology. In studios where computer technologies are not used, Fibonacci’s compass will be useful, which facilitates the choice of lengths of sections in accordance with the golden ratio principle. Dimensional proportions and the structure of such a compass are shown in Fig. 3.15.

