The repeated stress range, Srange, of compression fatigue tests (R=10) in this study is calculated by Srange=-0.9xSmin. If the Srange-N relationships in Fig. 5 are noticed, it can be understood intuitively that they are very close to the tension-compression Smax-N relationships in Fig. 6. These relationships are discussed in detail below.
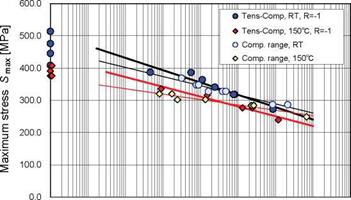
Smax in tension-compression fatigue tests (R=-1) is the stress amplitude and indicates the tension stress range or compression stress range. Fig. 10 shows Fig. 6 itself together with the Srange-N relationships converted from the compression Smin-N relationships in Fig. 5. Thick lines are the tension-compression Smax-N relationships and fine lines represent the compression Srange-N relationships, whose parameters are given in Table 4. Fig. 10 indicates that two S-N relationships at RT broadly overlap over a wide range. When the parameters of two S-N lines at RT in Table 2 are compared, the Srange-N line of compression fatigue has a lower intersection and a lower slope than those of the tension-compression Smax-N line, respectively. It turns out that the two S-N lines at RT gradually intersect. Moreover, Fig. 10 means that compression load cycles contribute primarily to tension-compression fatigue strength and most tension-load cycles have little influence on tension-compression fatigue strength in the range for which fatigue data exists.
Two S-N lines at 150°C in Fig. 10 clearly intersect. However, the slopes of the two straight lines are not very different. Therefore, it is obvious that the repeated application of a compression load mainly affects tension-compression fatigue strength. In addition, the compression fatigue strength expressed by Srange is lower than the tension-compression fatigue strength in the life region shorter than where the two lines intersect. This tendency is explained as follows. With regard to the mean stress in a compression fatigue test (R=10), the mean stress and stress amplitude constitute the maximum compression stress, which generates the final fatigue failure due to delamination buckling. Next, since the tension- compression fatigue strength is equal to the compression fatigue strength expressed by Srange in the vicinity of the intersection, this means that the tension-load repetition in tension- compression fatigue tests did not affect the tension-compression fatigue strength, as in the case of the tension-compression Smax-N relationship at RT. Simultaneously, the mean compression stress in the compression fatigue test becomes smaller, and this is considered to not have any influence on fatigue strength. In the life range larger than the intersection, the tension-compression fatigue strength becomes smaller than the compression fatigue strength expressed by Srange in Fig. 10, and this means that the tension-load repetition in a tension-compression fatigue test has an effect on delamination growth. The concept described above provides a coherent explanation for the S-N relationship at 150°C. Moreover, this kind of concept is also qualitatively applicable to S-N relationships at RT.
|
1.E+00 1.E+01 1.E+02 1.E+03 1.E+04 1.E+05 1.E+06 1.E+07 1.E+08 Number of cycles to failure N Fig. 10. S-N relationships from tension-compression fatigue tests and those showing the compression stress range from compression fatigue test results |
The authors derived an Srange-N relationship from the compression Smin-N data (R=10) of NH specimens of a T800/5250 CF/BMI laminate with [(±45, 02)2]S layup given by Gathercole et al. (Gathercole et al., 1994) and compared it with the tension-compression Smax-N data (R=-1). This comparison showed that the Srange-N relationship (R=-1) was very close to the Smax-N relationship (R=-1) and the two S-N lines gradually intersected in almost the same manner as those at RT in Fig. 10. On the other hand, Tyahla and McClellan reported fatigue test results of OH specimens of IM6/3100 and IM6/F650 CF/BMI composite materials with [0°(50%)/±45°(40%)/ 90°(10%)] layup for R=-1 and 10 (Tyahla & McClellan, 1988). Though IM6/3100 experienced longer lives during compression-only cycling (R=10) than reversed cycling (R=-1) on the basis of Smax-N diagrams under CTD and RTD conditions, IM6/F650 showed no extension of life during compression-only cycling compared to reversal cycling. They described that perhaps fatigue life in the case of IM6/F650 was controlled by delamination growth with compression loading and failure would occur when delaminations grew to a critical size.
The test results and discussion described above show that the repeated compression-load component of a tension-compression fatigue test has a large effect on fatigue strength over the entire life region, together with the maximum compression stress in the-short life region. The repeated tension-stress component has an effect only in the long-life region. This phenomenon is explained delamination growth in tension-compression fatigue being mainly driven by compression load repetition while final failure is generated by delamination buckling. This phenomenon and its interpretation are particularly noteworthy.


