. Accuracy Assessment

The overall accuracies of the supervised classification of the satellite images accounted for 94 % (for year 2000), 91 % (for year 2005), and 88 % (for year 2010), respectively (Table 13.3). The kappa statistics were 0.90, 0.80, and 0.79, respectively for the years 2000, 2005, and 2010 classifications.

The KHAT statistic was calculated to determine the statistical significance or classification accuracy between the years. The computed KHAT statistic is a better indicator of percentage because the values approach 1. The overall image accura­cies for each date, following verification from field data, were well above the

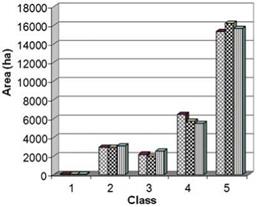
1 = water

2 Подпись: 0 Year 2000 a Year 2005 И Year 2010Подпись: Fig. 13.6 Estimated area of land cover types in years 2000, 2005, and 2010 in the Cameron Highlands. Accuracy Assessment= tea

3 = secondary forest shmb

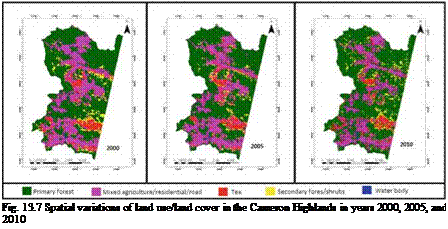
Подпись: Fig. 13.7 Spatial variations of land use/land cover in the Cameron Highlands in years 2000, 2005, and 2010

4= mixed agriculture/residential/ road 5= primary forest

Table 13.3 Accuracy assessment and kappa statistic for land cover classification (years 2000, 2005, and 2010)

Image

Accuracy assessment (%)

Kappa (K) statistic

SPOT 5 Year 2000

94

0.9

SPOT 5 Year 2005

91

0.84

SPOT 5 Year 2010

88

0.79

generally accepted 85 % standard of accuracy for image classifications (Foody 2003), with kappa statistics above 0.75 (Nagendra et al. 2003). The generally accepted overall accuracy level for land use maps is 85 %, which is approximately equal in accuracy for most categories (Jensen 1986; Mohd Hasmadi and Kamaruzaman 2008).

Land cover type

Landscape metric/year

Primary

forest

Secondary forest and shrubs

Mixed agriculture, residential, roads

Tea

plantations

Water

bodies

CA

2000

15,384.4

2,185.6

6,468.1

2,939.9

31.8

2005

16,240.4

2,021.9

5,782.6

2,924.4

40.5

2010

15,691.8

2,553.5

5,546.8

3,121.5

96.2

PLAND

2000

56.9122

8.1951

23.8588

10.9076

0.1263

2005

60.2359

7.281

21.4083

10.9299

0.1449

2010

58.1235

9.3544

20.5035

11.6637

0.3549

NP

2000

499

1,306

564

1,010

10

2005

450

1,619

530

1,159

40

2010

545

1,802

437

1,441

110

PD

2000

1.8474

4.8351

2.088

3.7392

0.037

2005

1.666

5.9938

1.9622

4.2908

0.1481

2010

2.0177

6.6713

1.6179

5.3349

0.4072

AREA_MN

2000

30.8068

1.6949

11.4264

2.9171

3.4124

2005

36.1563

1.2147

10.9106

2.5473

0.9786

2010

28.8069

1.4022

12.6732

2.1863

0.8714

LPI

2000

34.4468

0.3957

13.5959

2.0065

0.1003

2005

38.8871

0.2341

4.9977

1.568

0.0539

2010

40.6688

0.3753

5.9545

1.7055

0.1152

CA class area, PLAND percent of landscape, NP number of patches, PD patch density, AREA_MN mean patch area, LPI largest patch index

Updated: October 12, 2015 — 12:26 pm