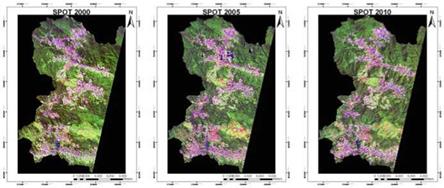
Three SPOT 5 satellite imageries were used, obtained from the Agency of Remote Sensing Malaysia (ARSM). The descriptions of the images are as presented in Table 13.1; multitemporal SPOT data are shown in Fig. 13.4. The cloud covers for these datasets are less than 5 %, and quality is good.
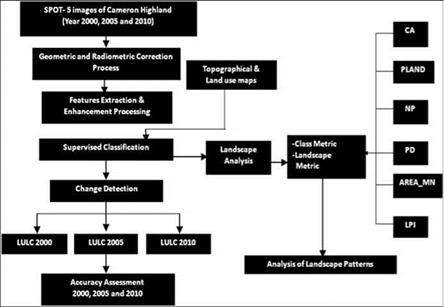
Analysis of SPOT 5 multitemporal data utilizes several processes. The summary of steps is outlined to meet the objective of the study. The processes were employed from various datasets to extract the information and gain results. Figure 13.5 shows a workflow of all the steps taken as well as providing various elements of tasks to gain results.
|
Data source |
Date captured |
Spatial resolution (m) |
Band description |
|
SPOT 5 269/341 (path/row) |
8 July 2000 |
20 |
Four bands |
|
SPOT 5 268/341 (path/row) |
19 April 2005 |
10 |
Four bands |
|
SPOT 5 268/341 (path/row) |
20 February 2010 |
10 |
Four bands |
|
Fig. 13.4 SPOT 5 images of 2000, 2005, and 2010 (RGB: 4-3-1) |
|
Fig. 13.5 Workflow for the research methodology. CA class area, PLAND percent of landscape, NP number of patches, PD patch density, AREA_MN mean patch area, LPI largest patch index |


